Terraview
Product design for vineyard management web app (Terraview)
Category:
Responsive Web App
Technologies used:
Sketch, Axure, Miro, Photoshop, Illustrator
My Contribution:
UX Design, UI Design, Brand application
Project Overview
Terraview’s Vineyard Management Web App was developed to help vineyard owners monitor and optimise their operations using satellite imagery, drone monitoring, and real-time environmental data. The platform provides comprehensive insights into soil conditions, weather patterns, and crop health, enabling data-driven decisions to enhance vineyard productivity.
As the dedicated product designer, I was responsible for designing a scalable, intuitive interface that aligns with Terraview’s brand identity while ensuring usability for vineyard managers and agronomists. The project involved extensive UX research, data visualisation, and interactive UI design solutions to support precision viticulture.
Vineyard owners and agronomists lacked a unified platform that could provide them with real-time data on soil health, crop development, and weather conditions. Traditional methods were inefficient, and there was a need for a digital solution that could integrate satellite data, drone imagery, and on-the-ground reporting into a single dashboard.
Challenges Identified
Lack of visibility into soil health metrics and crop conditions.
Difficulty in tracking weather impact on grape yield.
Need for a customisable interface to manage different vineyard plots.
Limited access to historical data for decision-making.
Problem Statement
Goal
The goal was to design a data-rich, interactive web application that allows users to:
Monitor vineyard conditions using satellite and drone imagery.
Analyse soil health, moisture levels, and environmental conditions.
Customise dashboards to track vineyard performance over time.
Receive notifications and timeline updates on crop growth, soil reports, and drone visits monitoring for pests and biohazards among all else.
Key Responsibilities
As the Senior UX/UI Designer, I:
Participated in UX research including workshops, stakeholder interviews, and took into account competitive analysis.
Designed interactive wireframes and prototypes to validate usability.
Created a scalable UI design components following Terraview’s brand guidelines.
Developed custom data visualisations for satellite maps and soil reports.
Delivered comprehensive design documentation for development handoff.
The Solution
Research & Discovery
Participated in subject matter expert workshops to understand vineyard operations.
Took into account competitive analysis of existing precision agriculture tools.
Identified key user needs through stakeholder meetings.
Mapped out user journeys and pain points.
Wireframing & Prototyping
Created low-fidelity wireframes to define dashboard structure.
Developed an interactive prototype to test user flows.
Iterated designs based on feedback from agronomists and vineyard managers.
UX Design
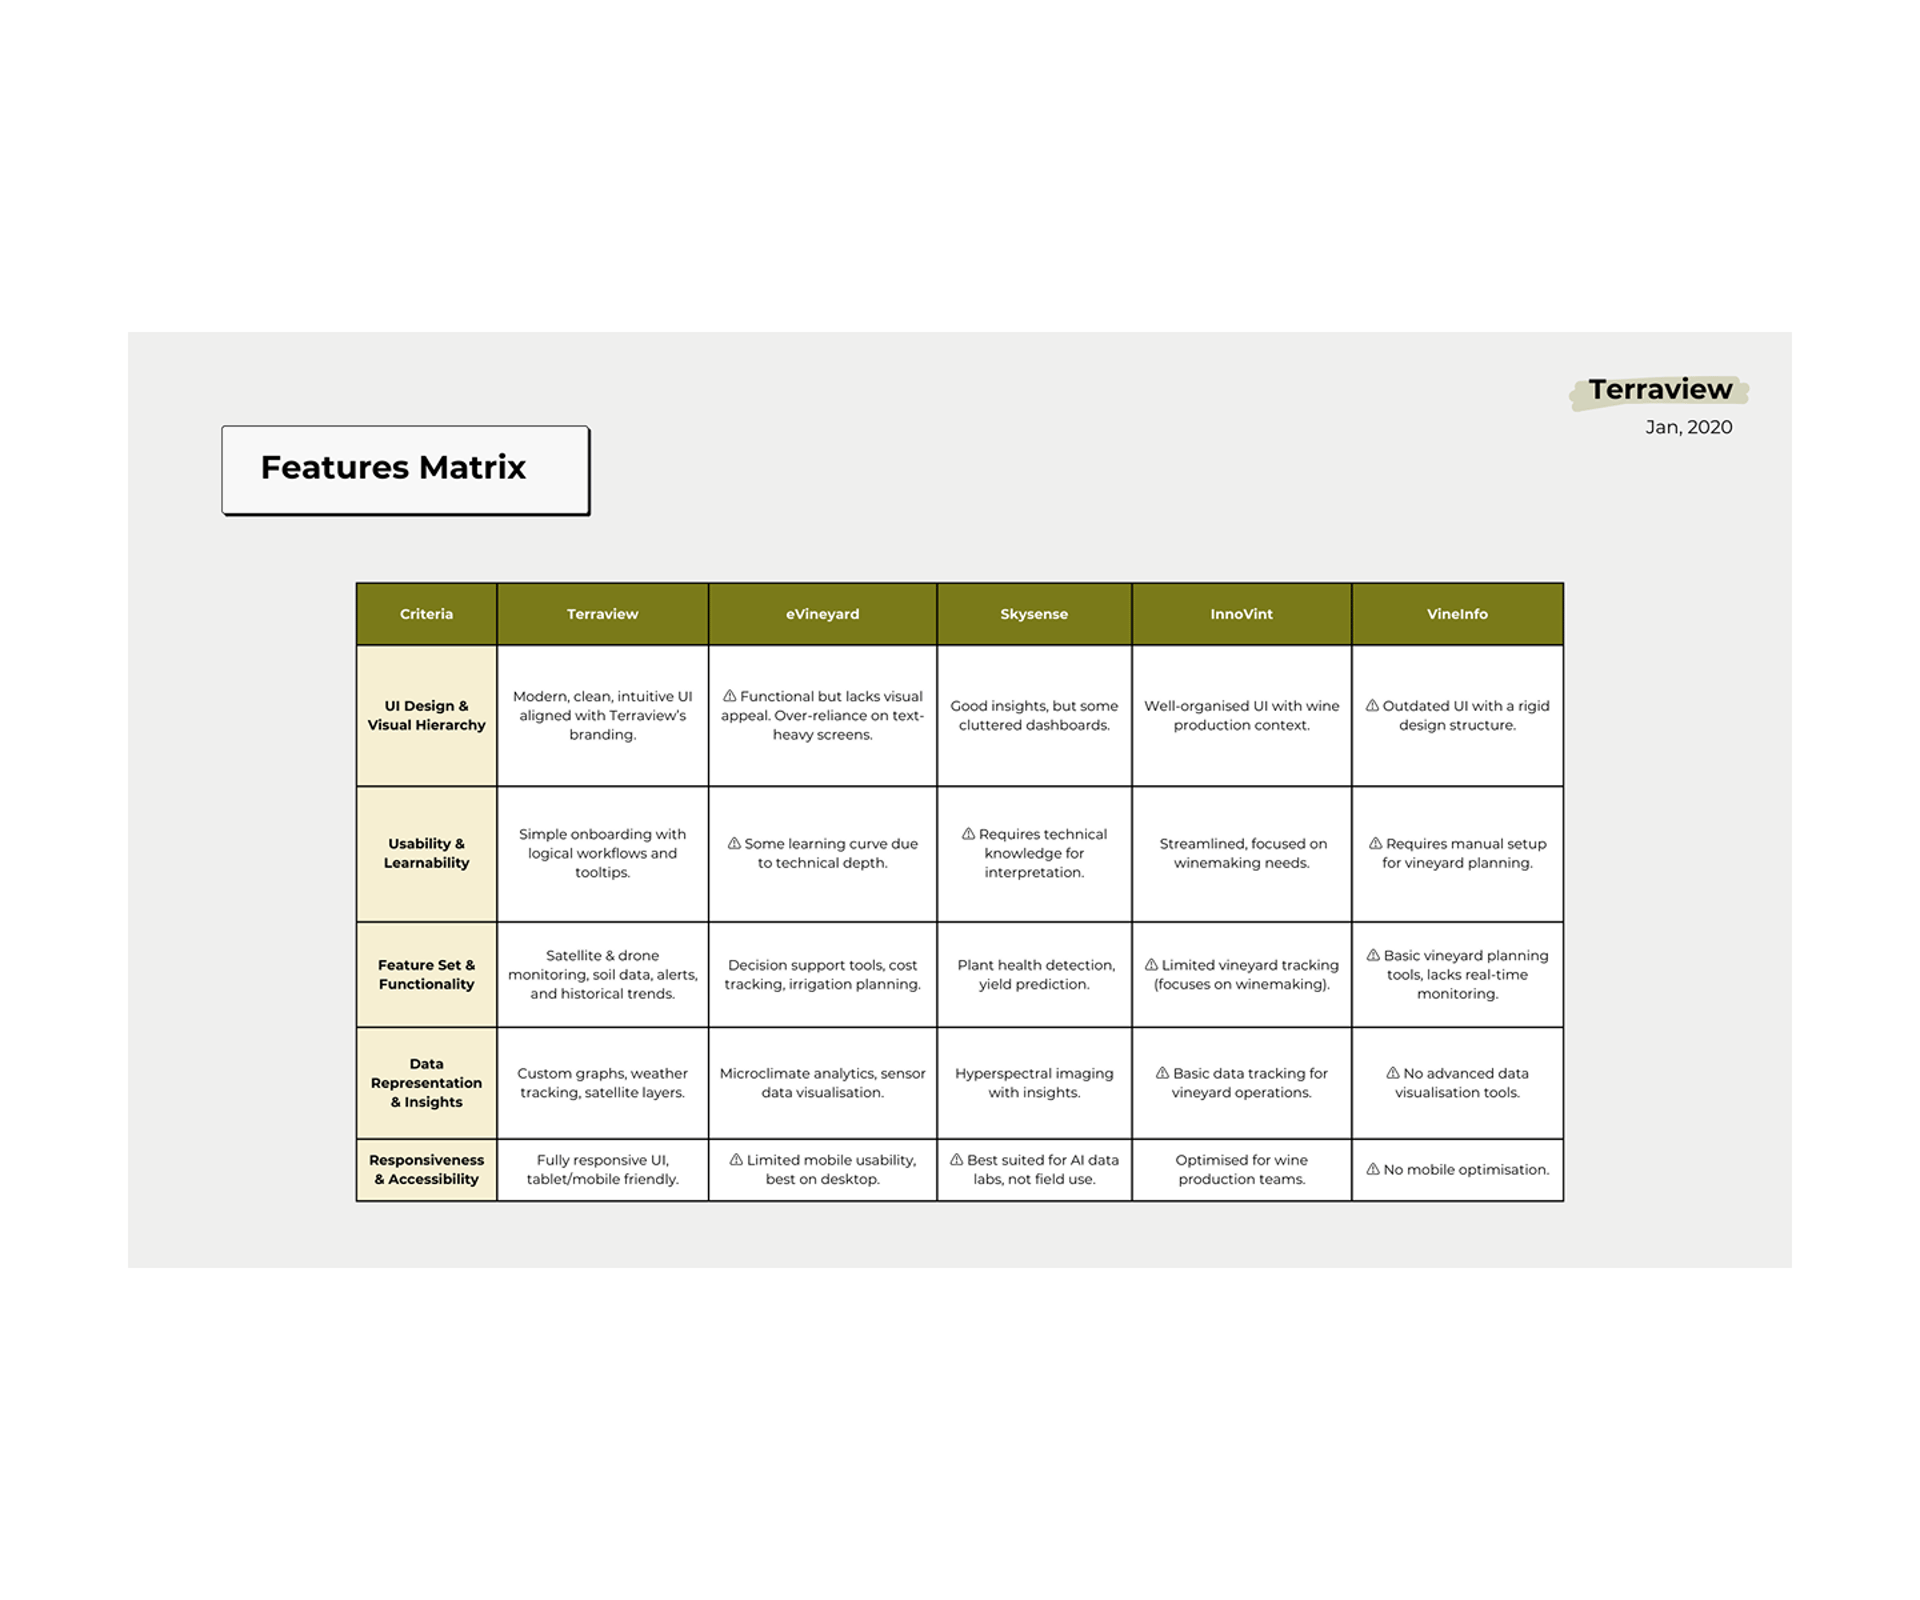
Competitive Analysis
Competitors Analysed
eVineyard – Precision viticulture data analytics & decision support.
Skysense – Vineyard monitoring with drones & satellite imagery.
InnoVint – Cloud-based wine production & vineyard tracking.
VineInfo – Web-based vineyard planning & monitoring tools.
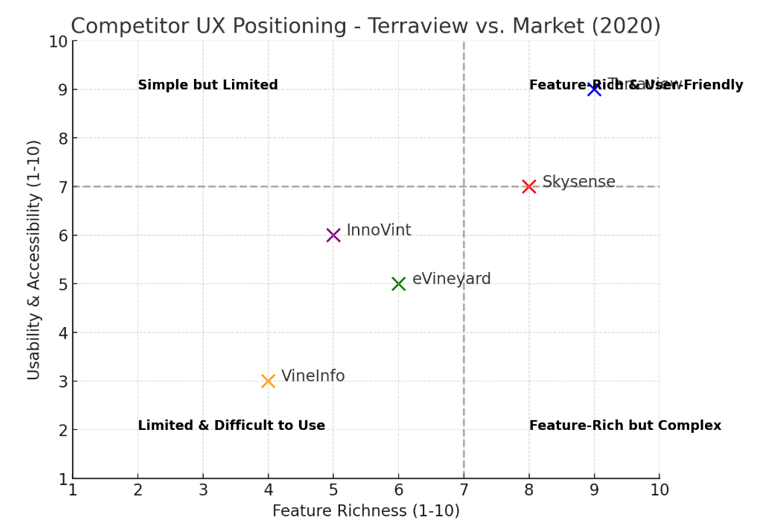
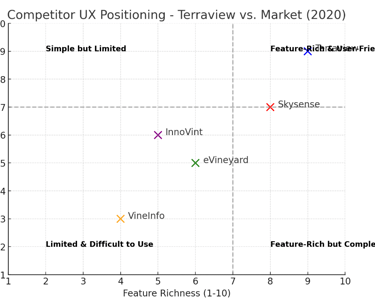
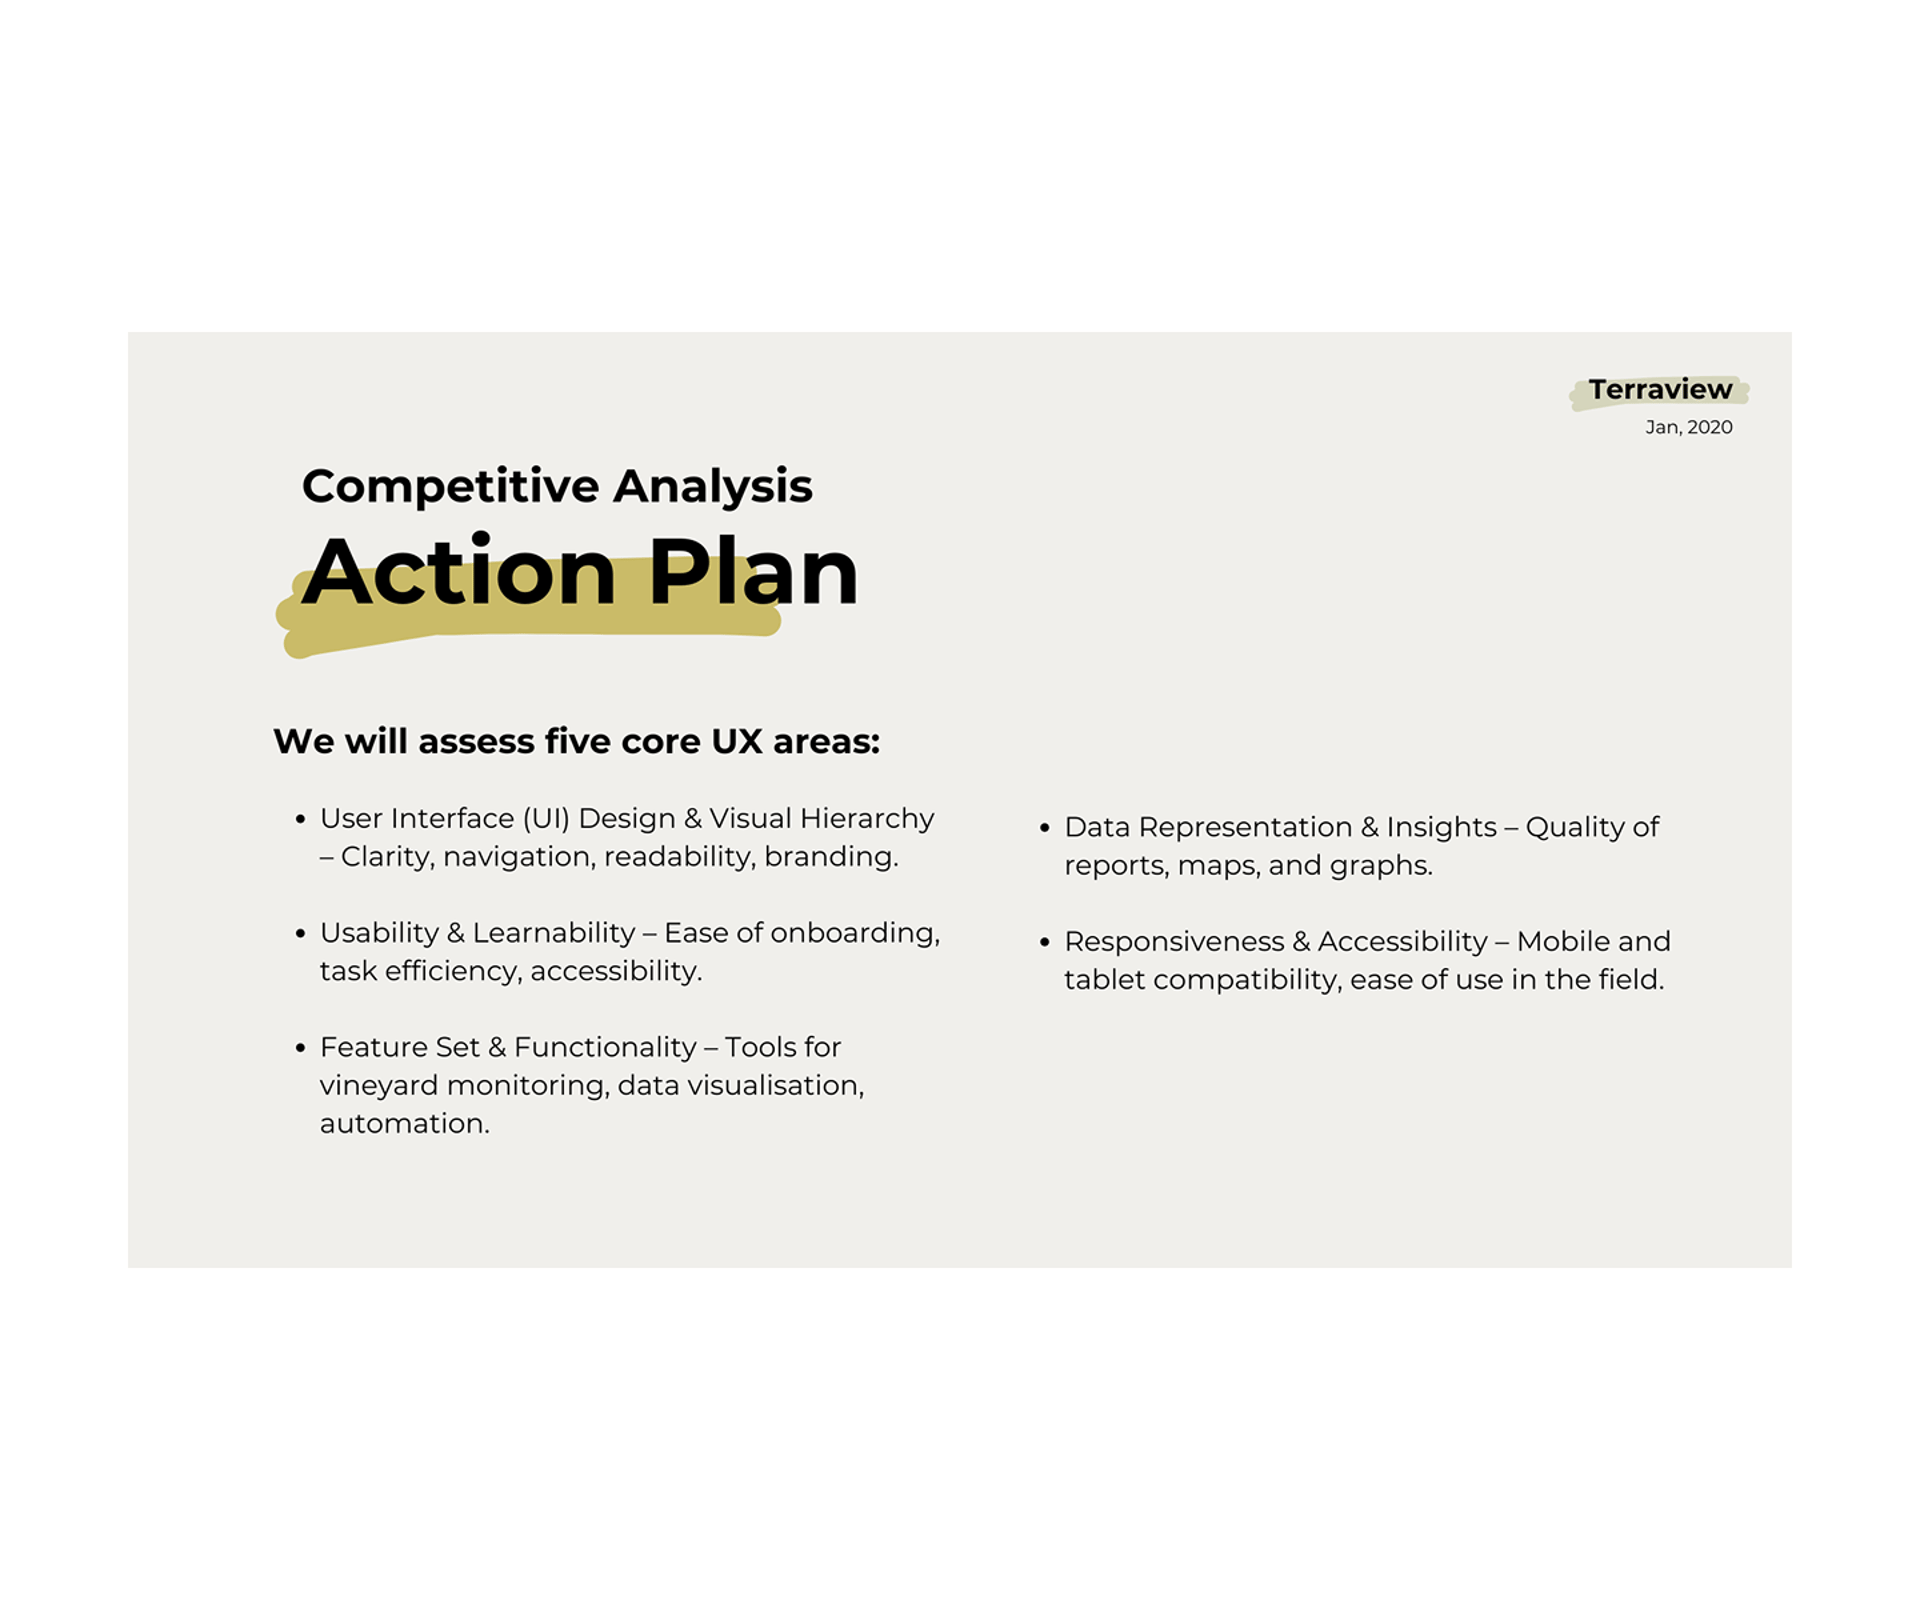
The analysis is based on five core UX areas:
UI Design & Visual Hierarchy – Navigation, branding, clarity.
Usability & Learnability – Ease of onboarding, accessibility.
Feature Set & Functionality – Key tools for vineyard monitoring & automation.
Data Representation & Insights – Quality of graphs, reports, and maps.
Responsiveness & Accessibility – Mobile/tablet compatibility, ease of field use.
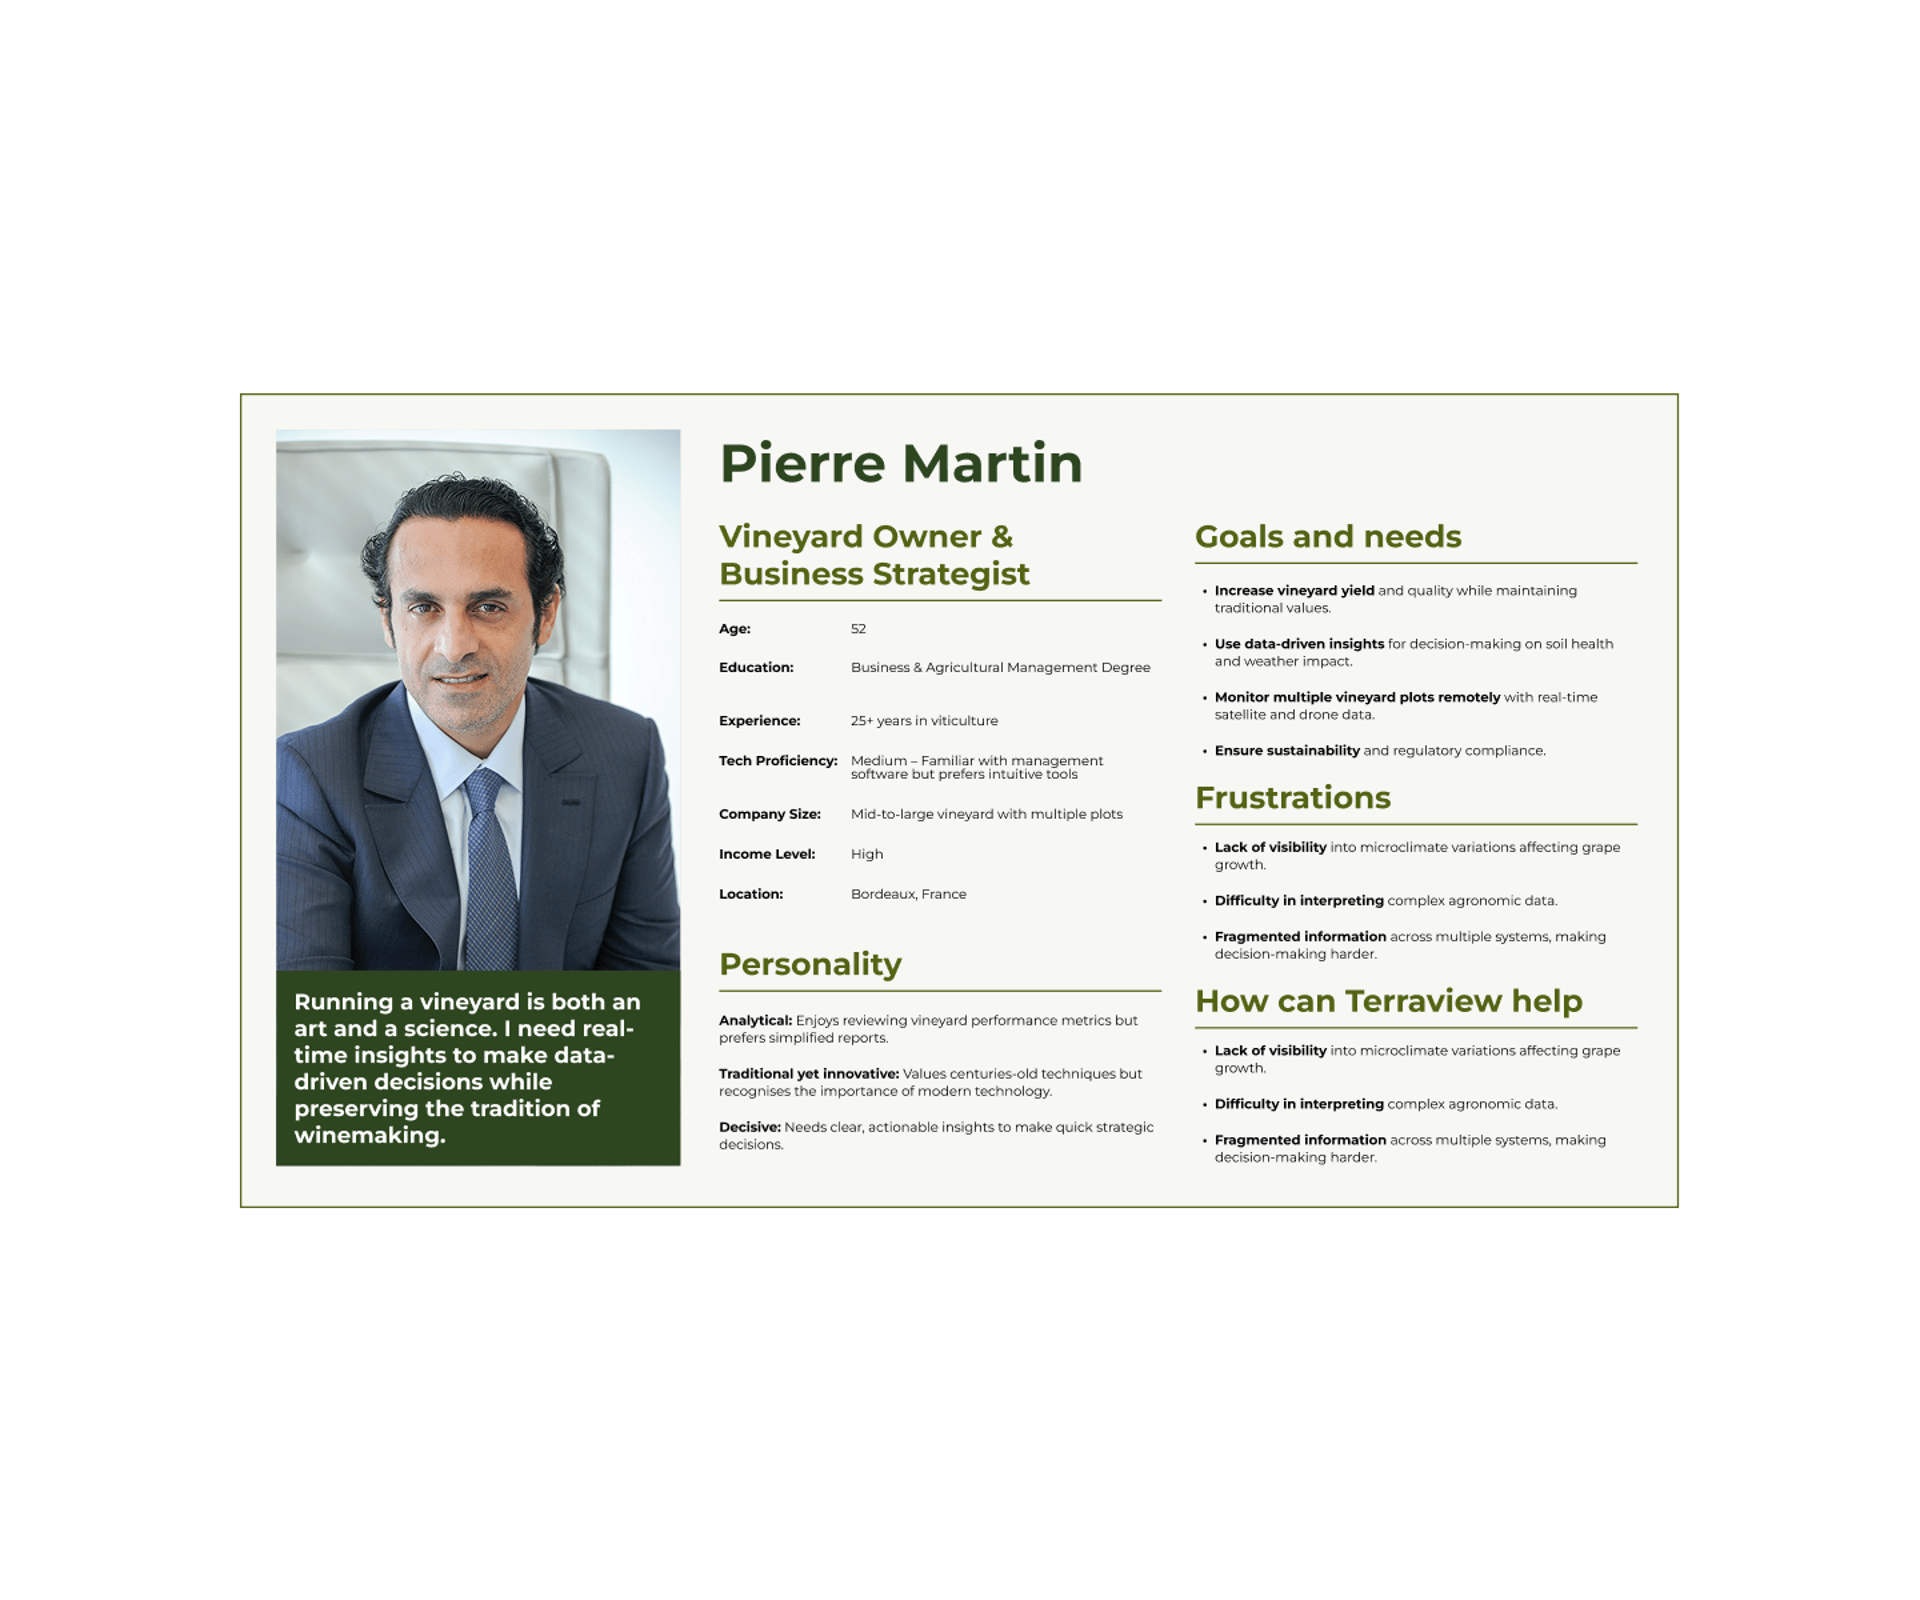
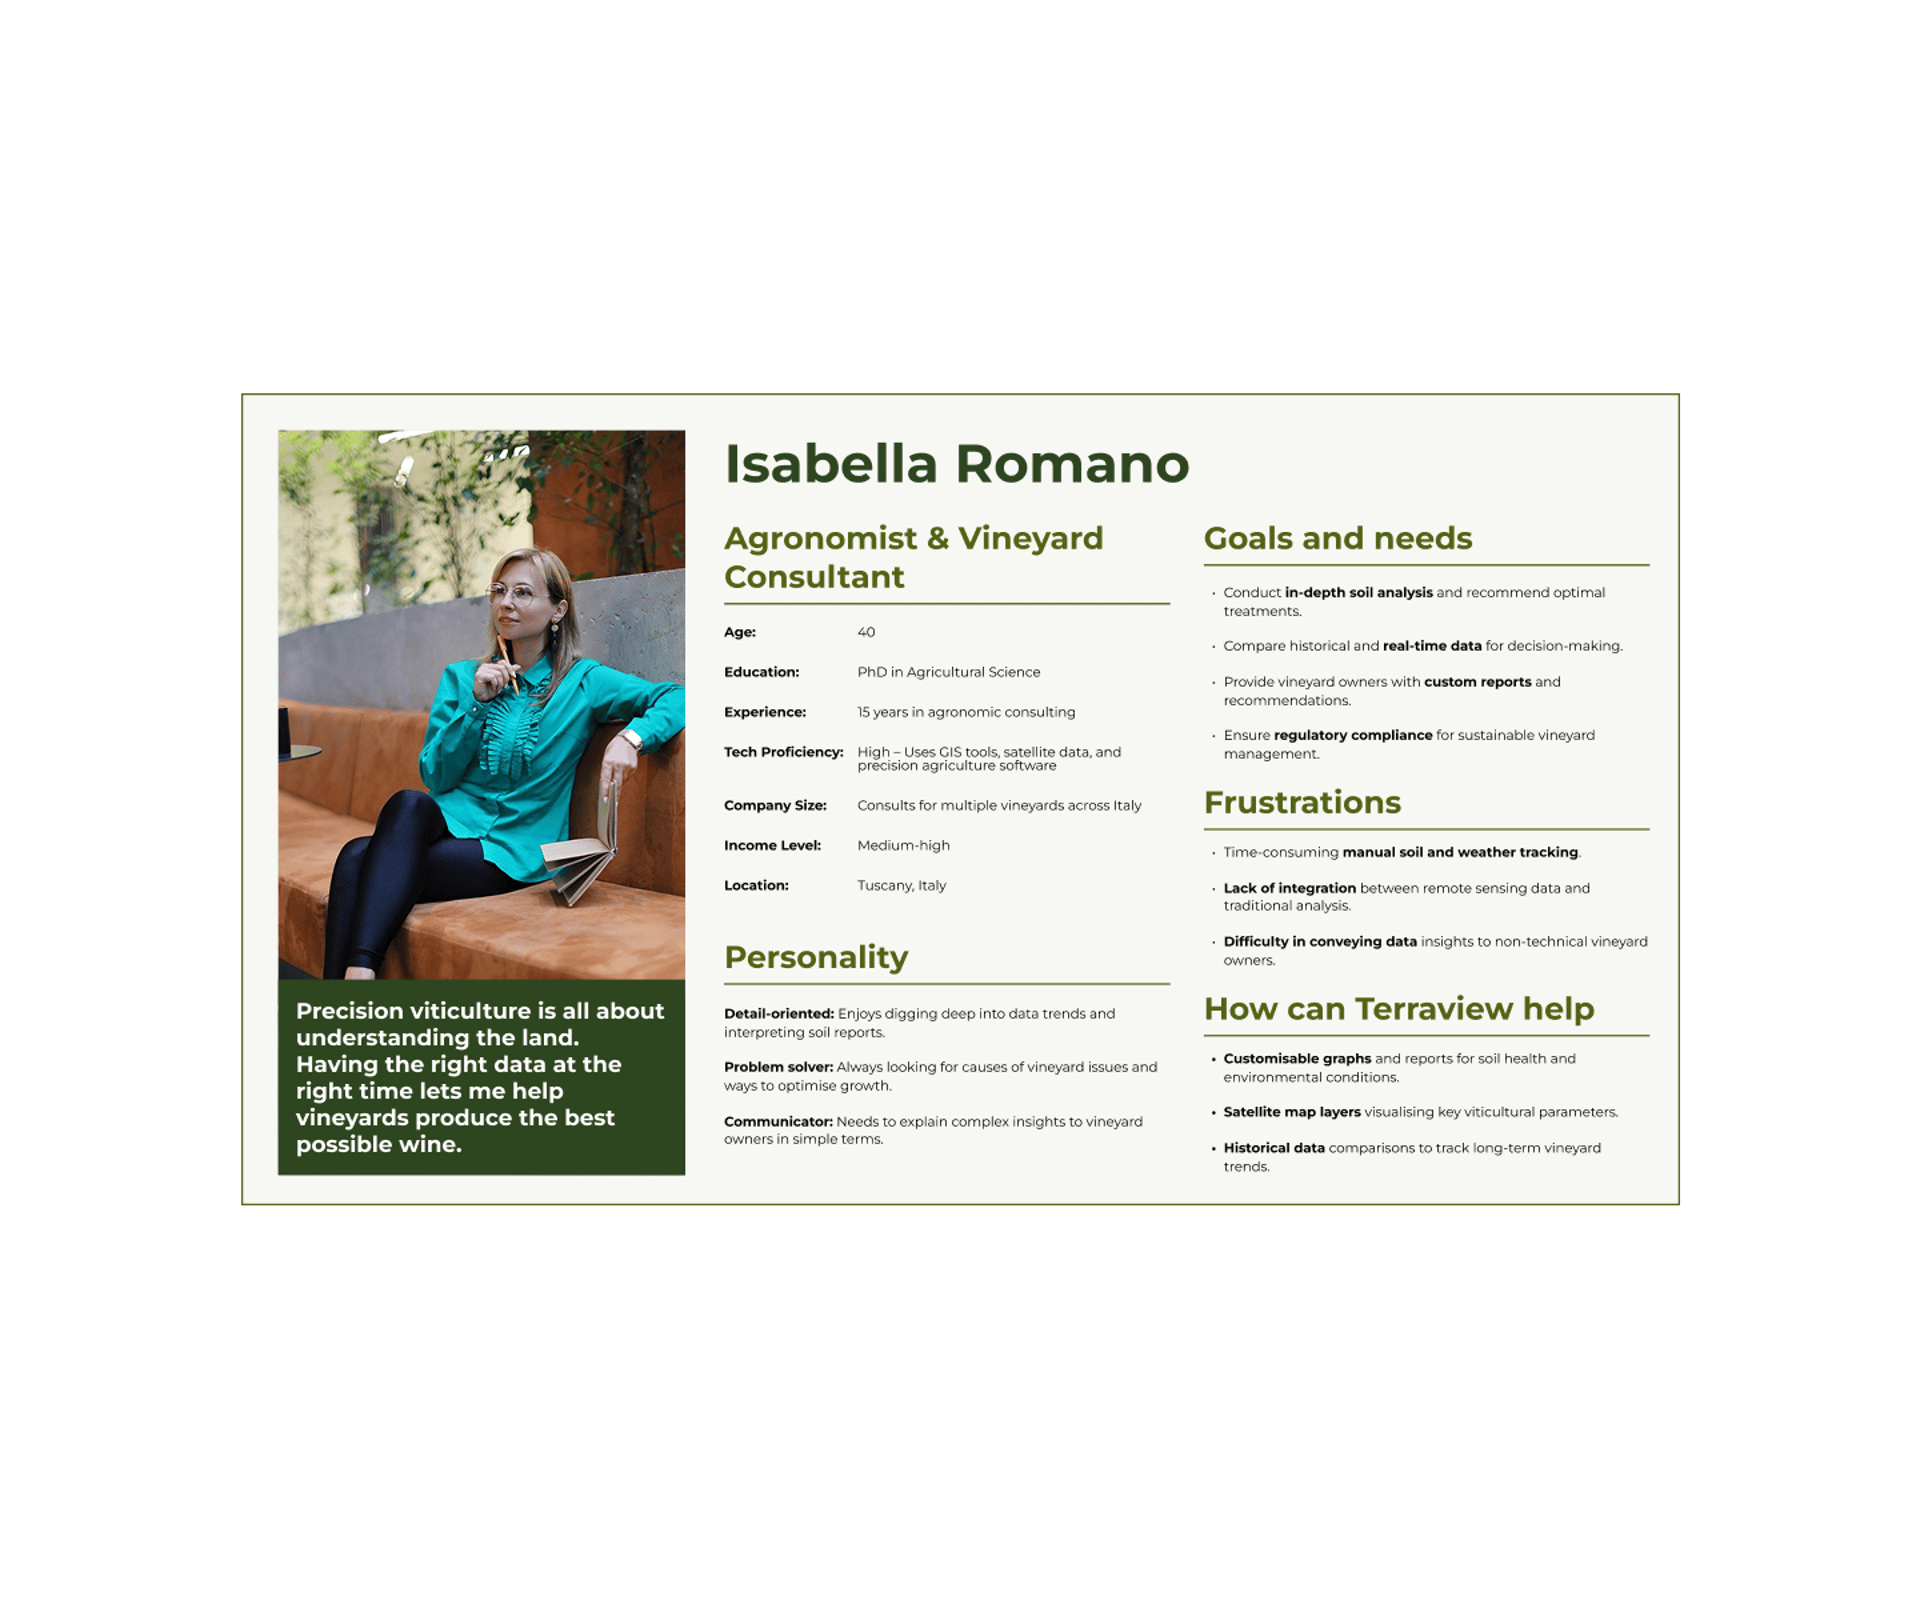
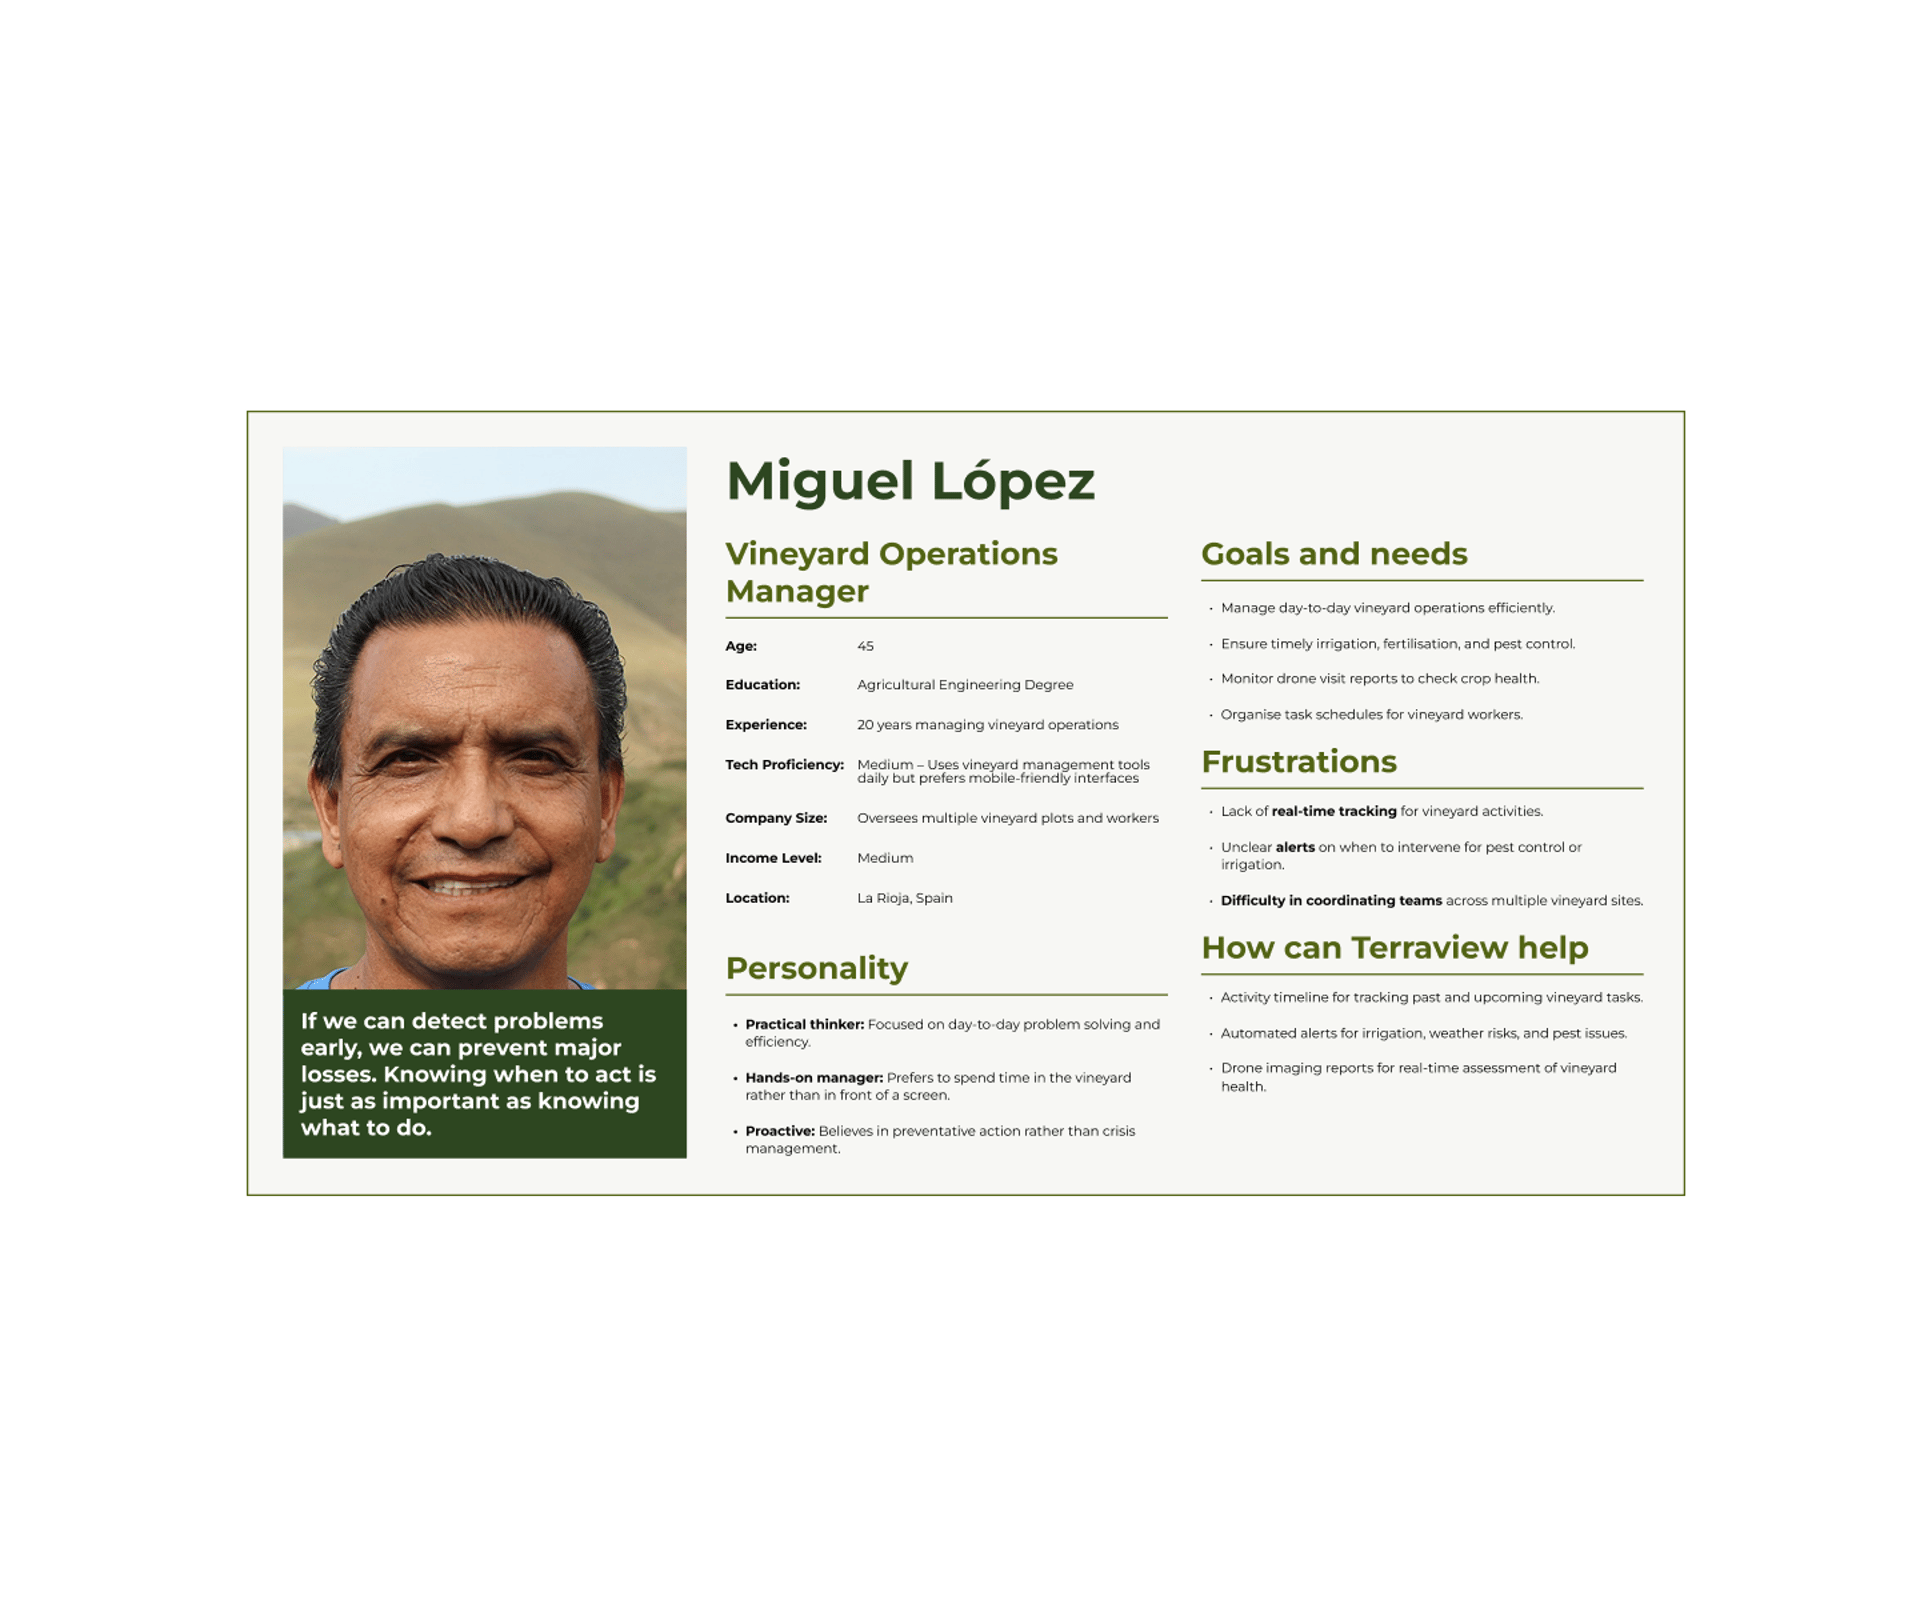
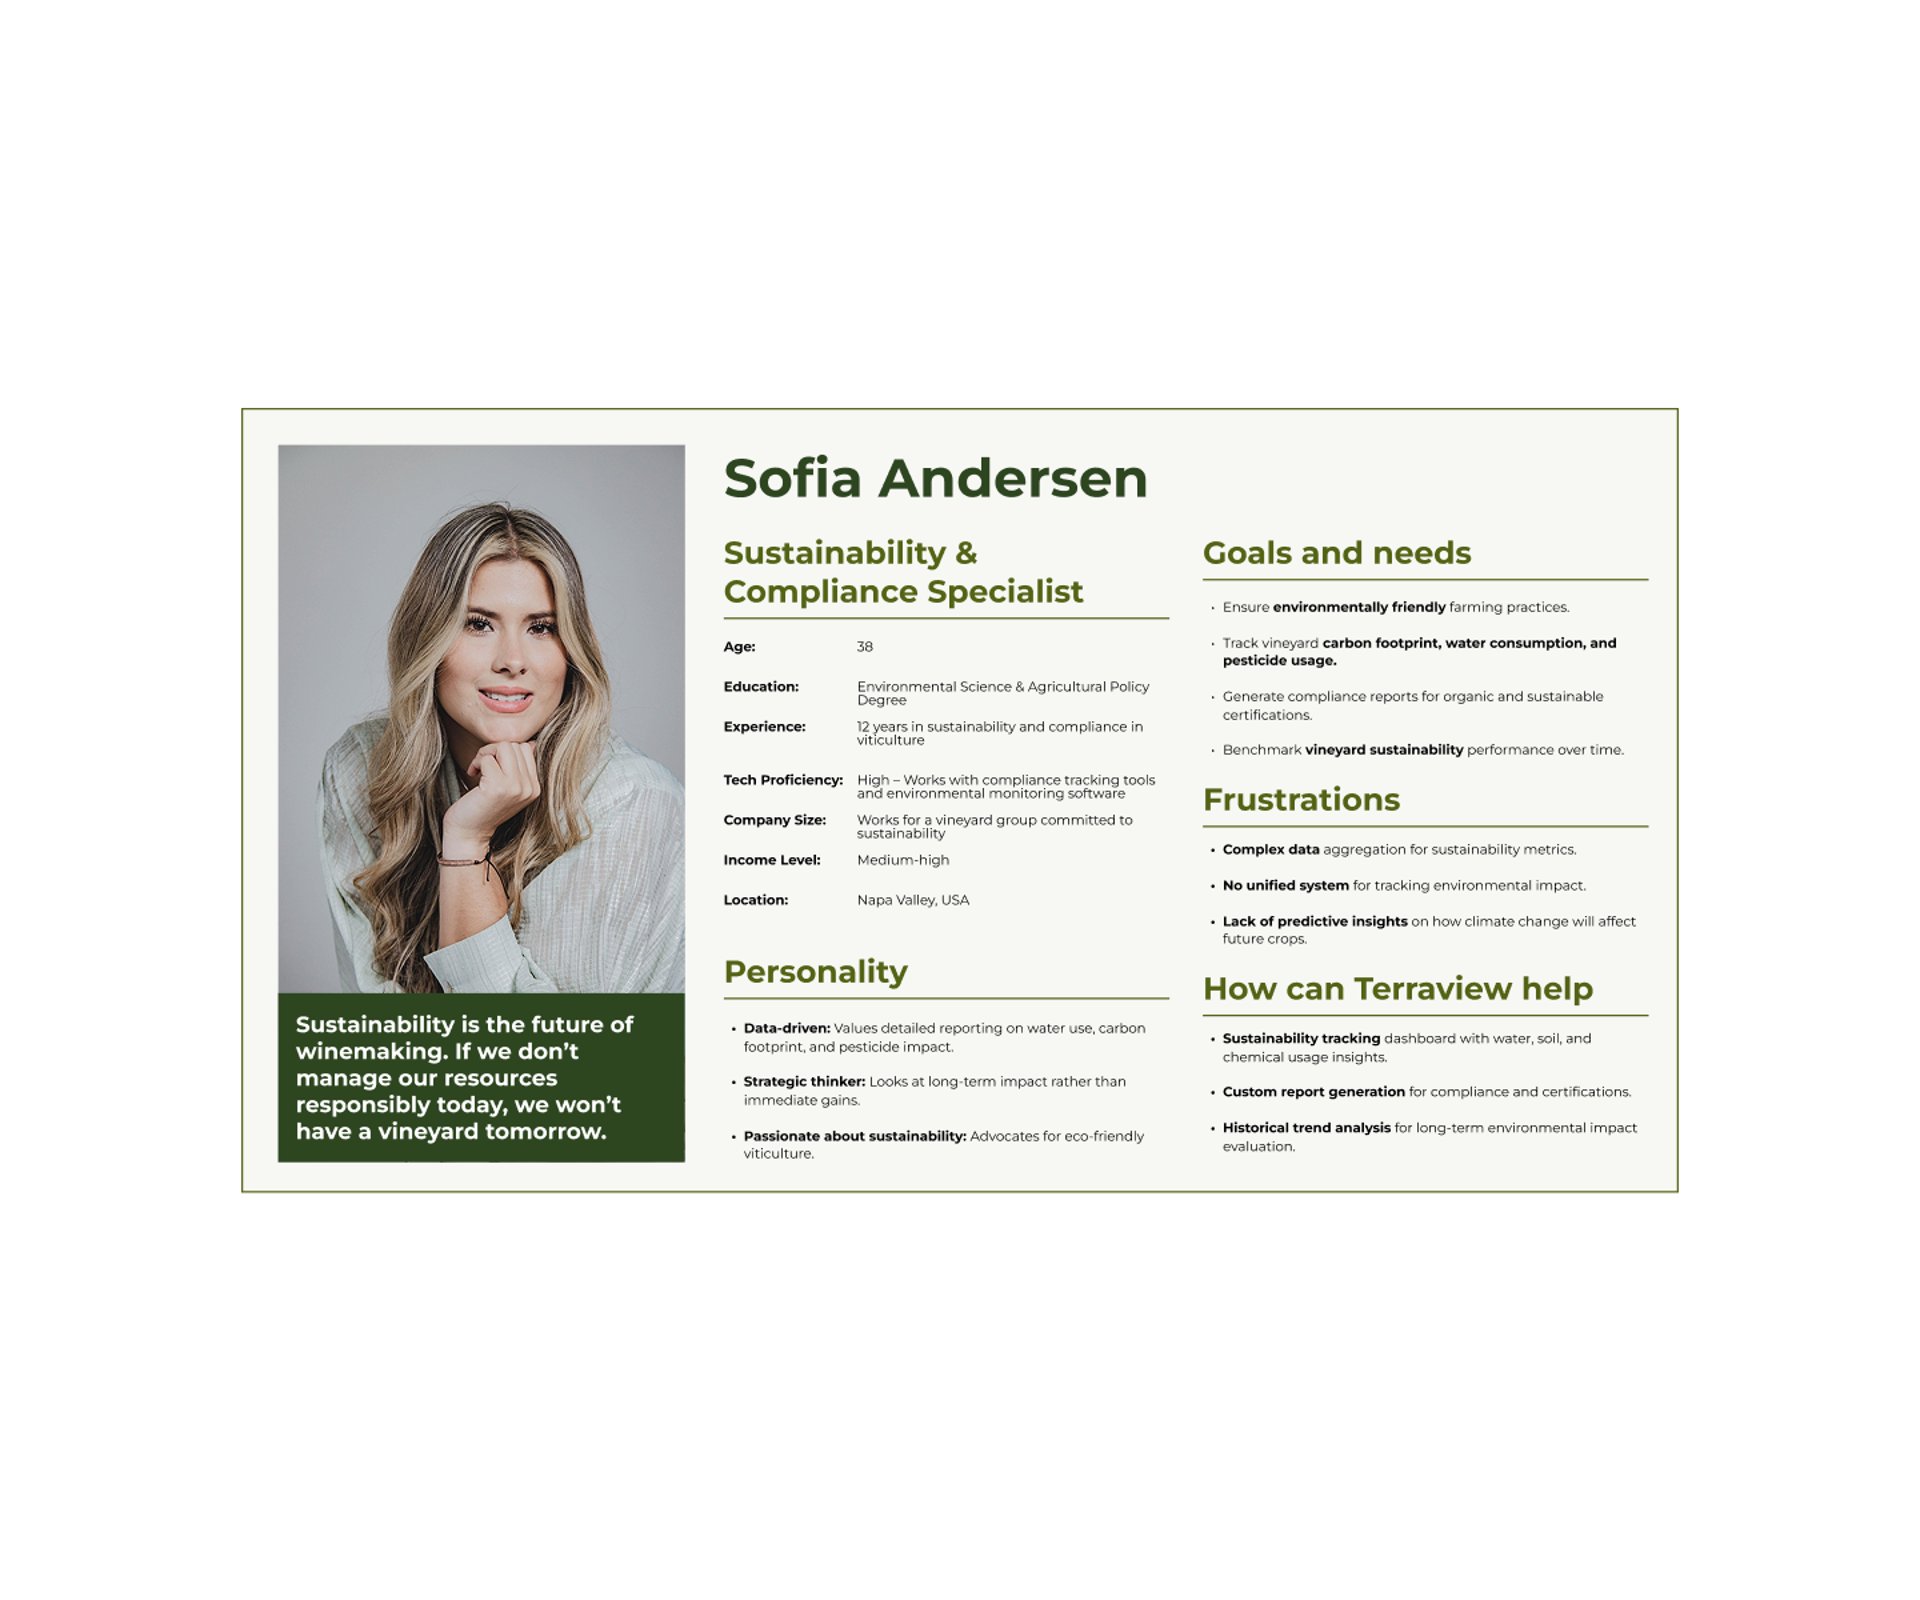
Personas
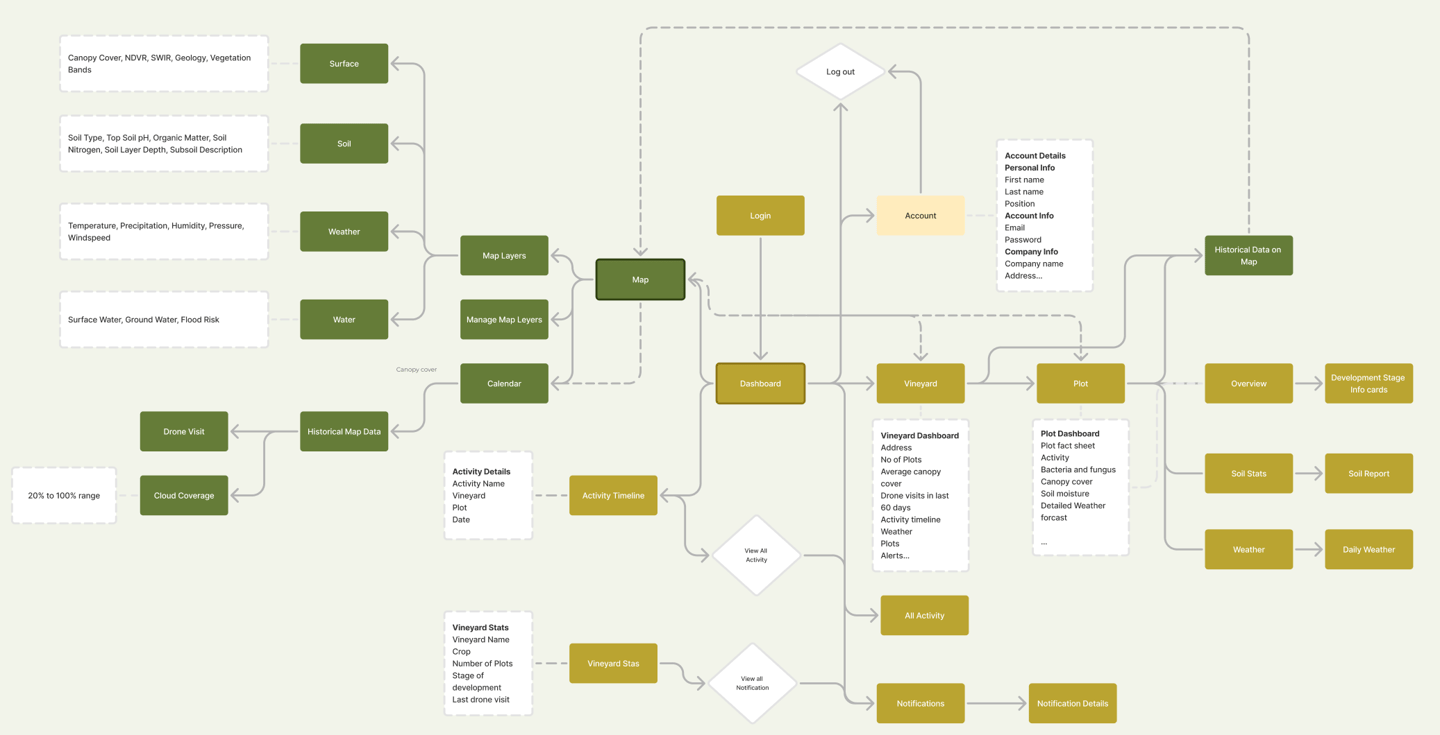
User Flow


Wireframes
UI Design
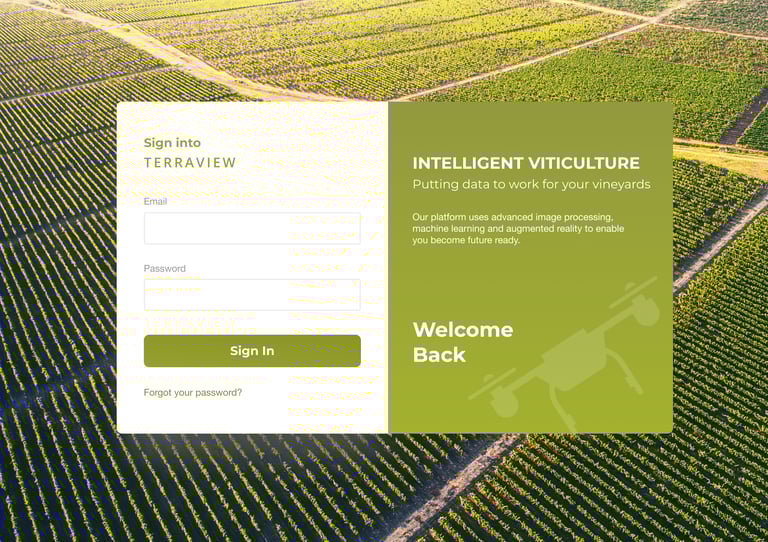
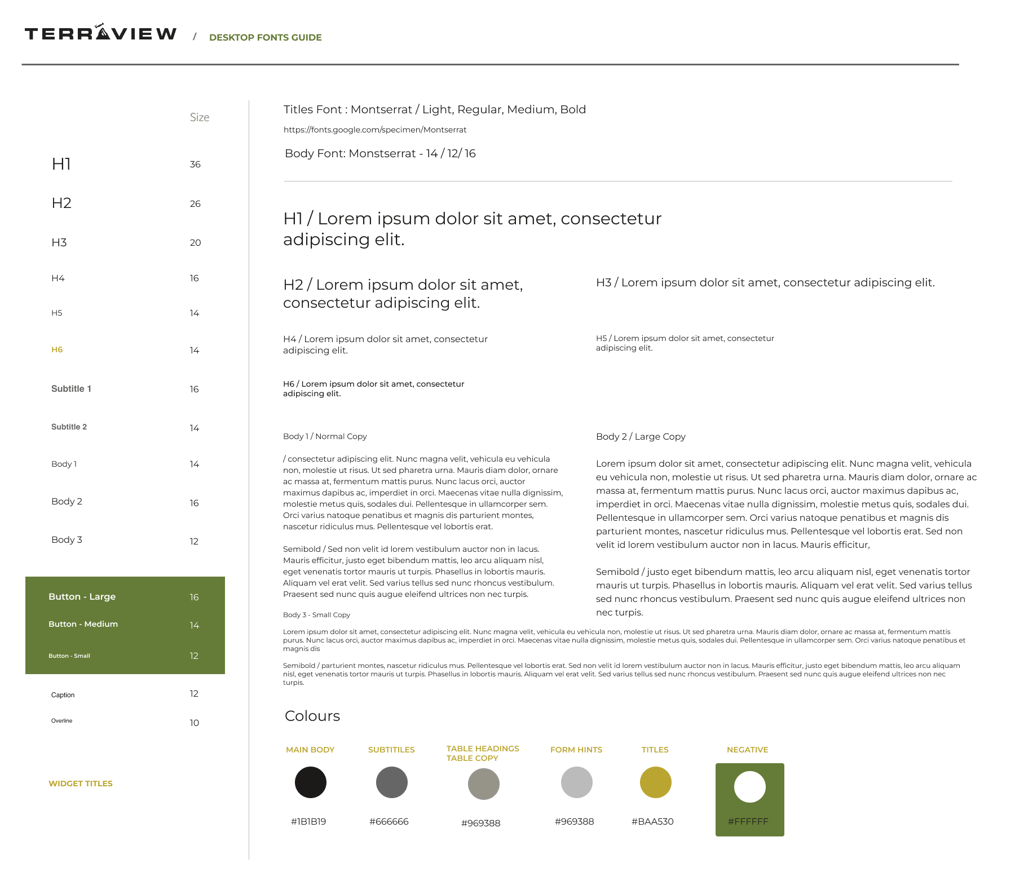
Branding & Visual Design
Applied Terraview’s brand identity through consistent colours, typography, and UI components.
Used earthy tones and clean layouts to reflect the agricultural context.
Designed an accessible, user-friendly interface for desktop and mobile.
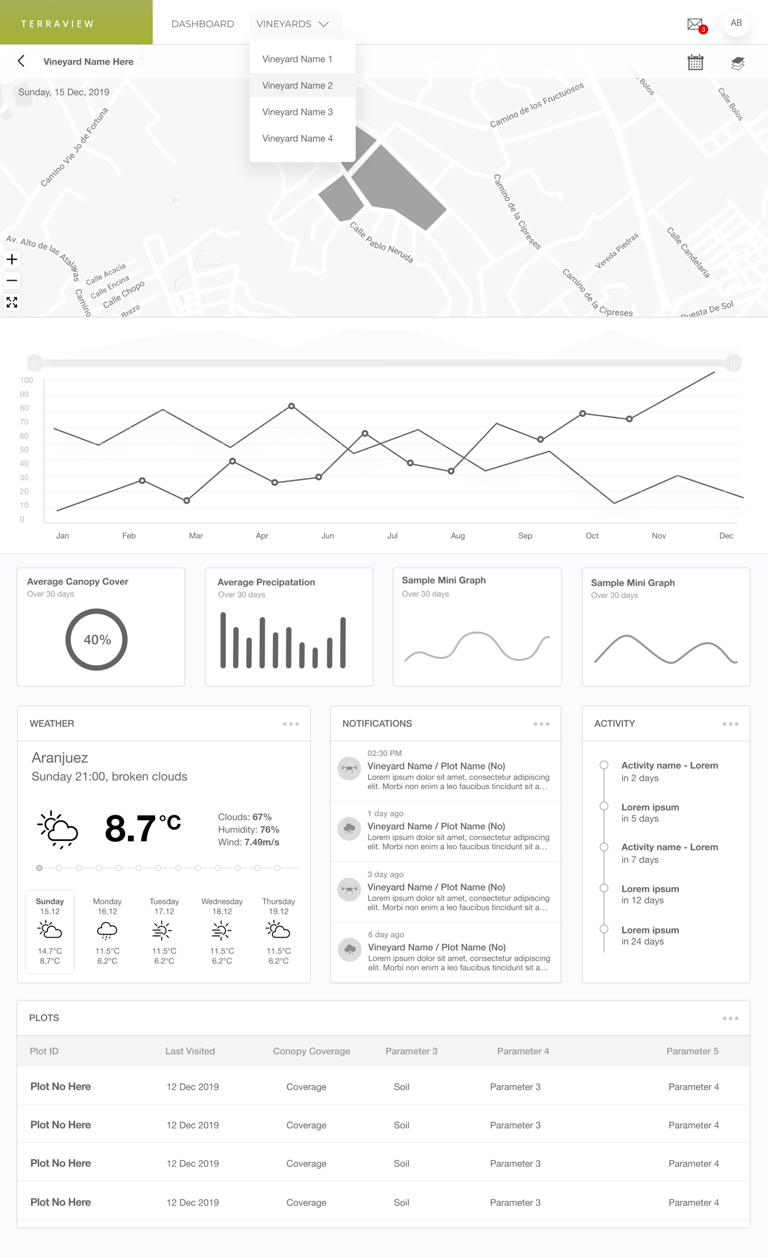
Dashboard & Data Visualisation
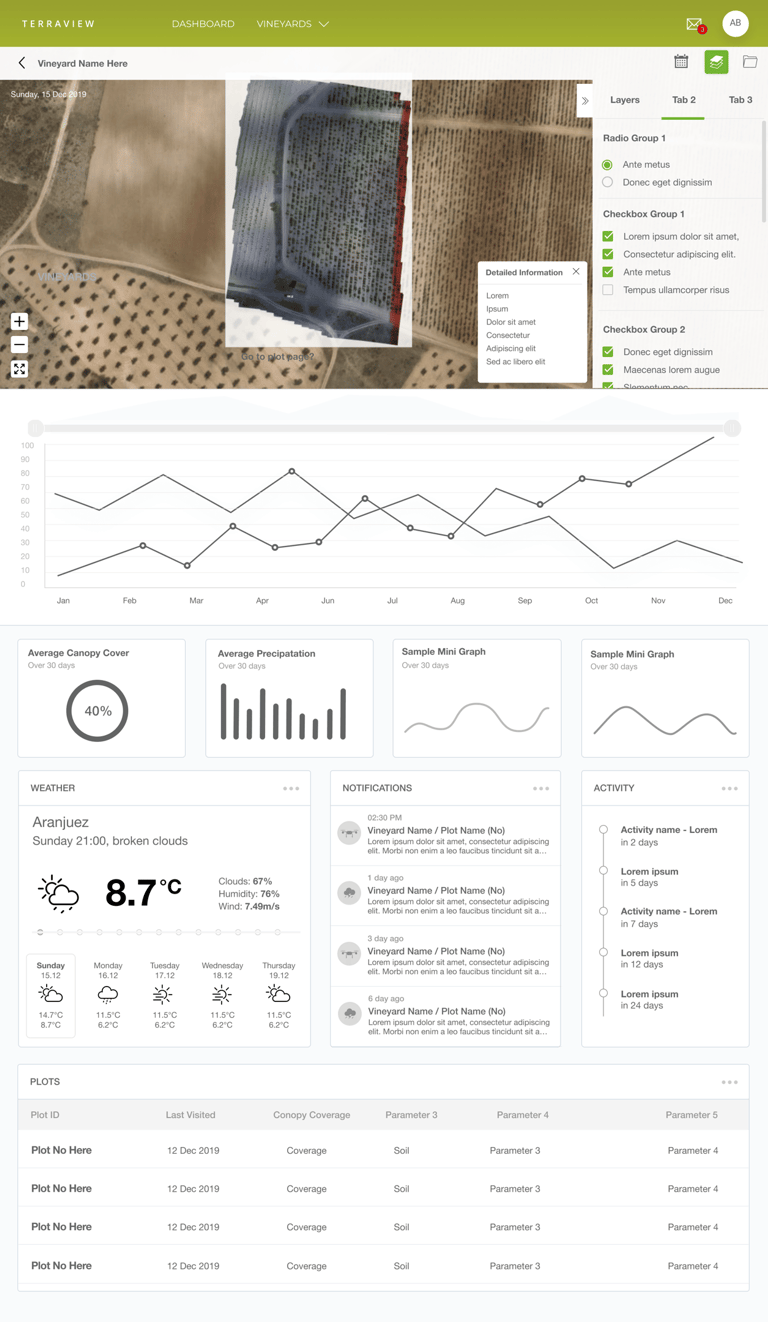
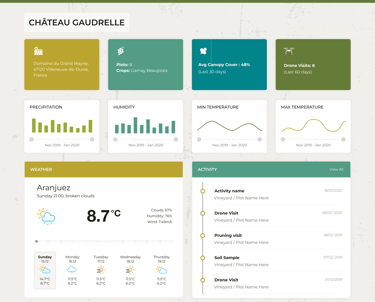
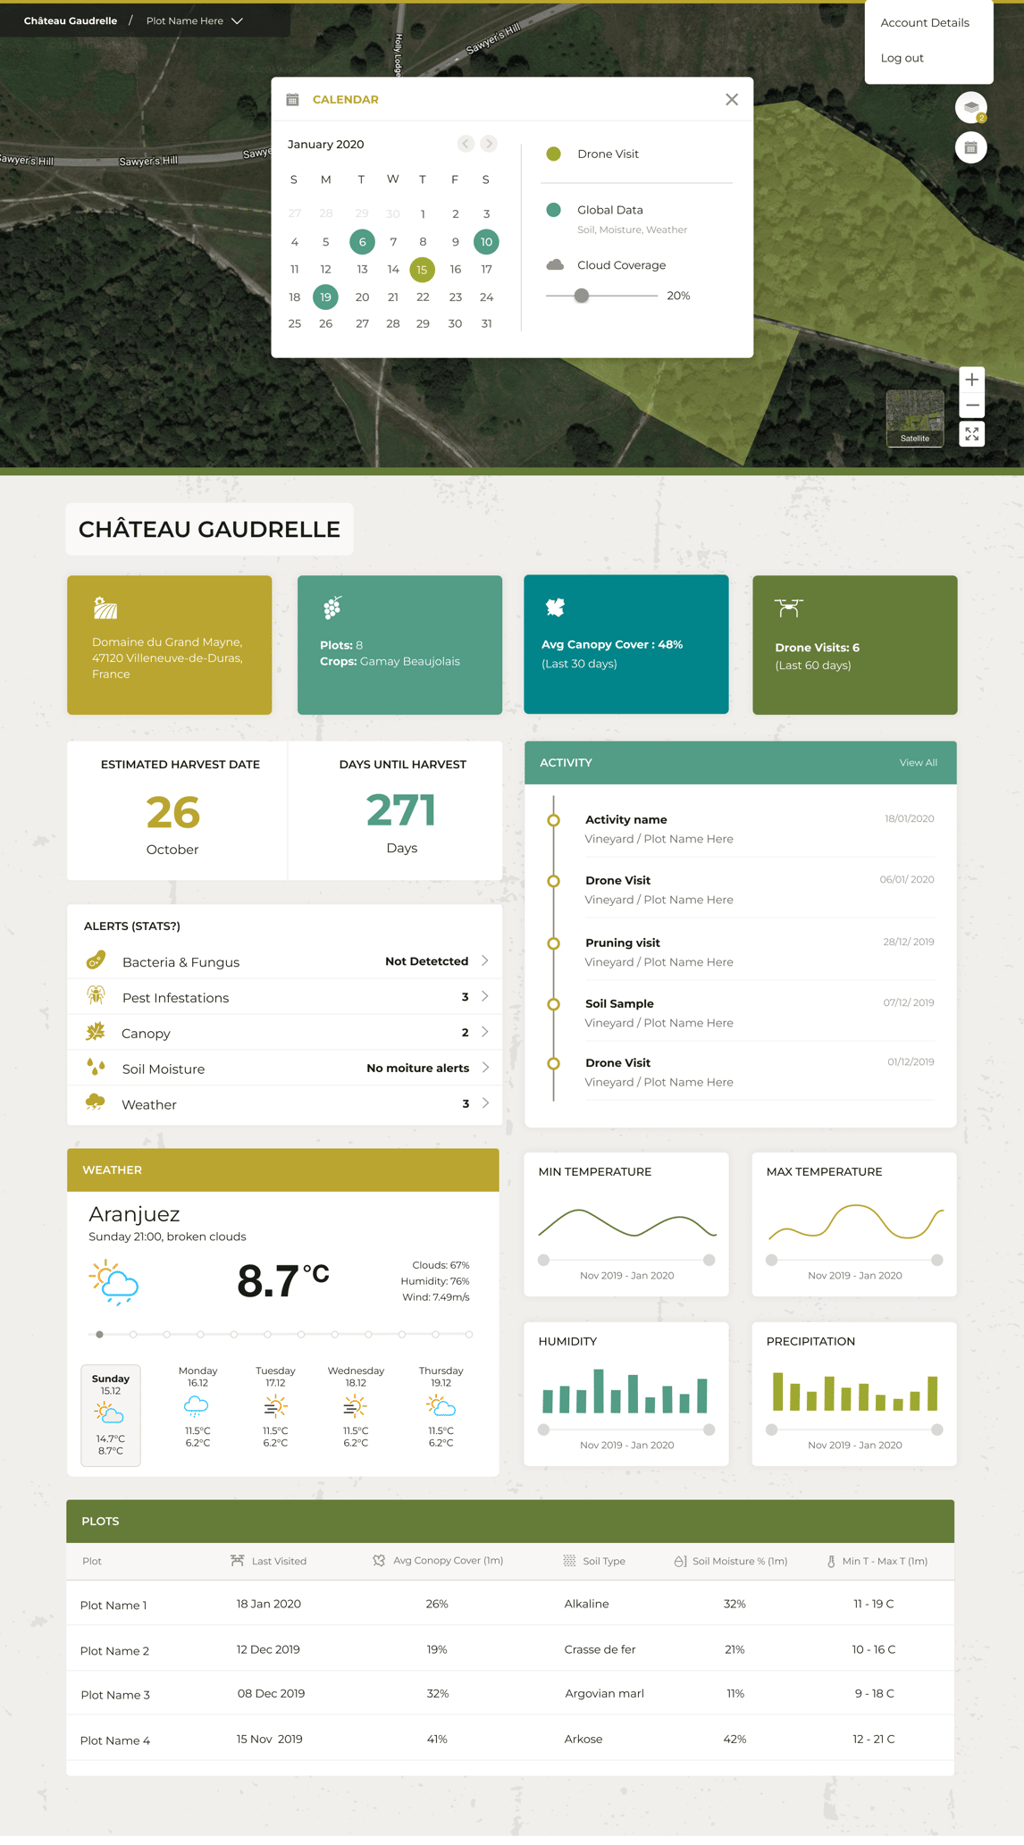
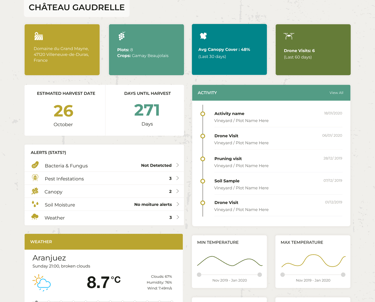
Developed a main dashboard with an overview of vineyard performance, alerts, and environmental conditions.
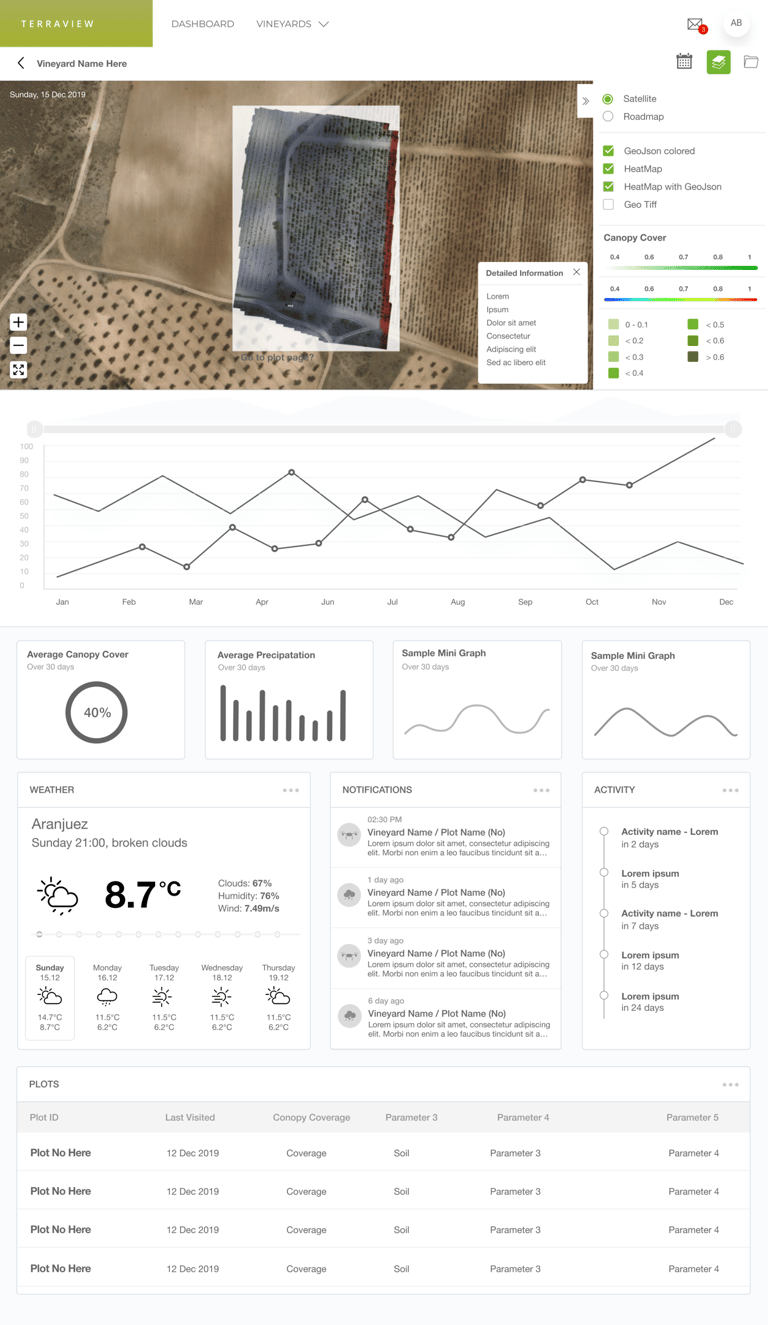
Created a vineyard dashboard displaying real-time satellite imagery, canopy cover, and drone activity.
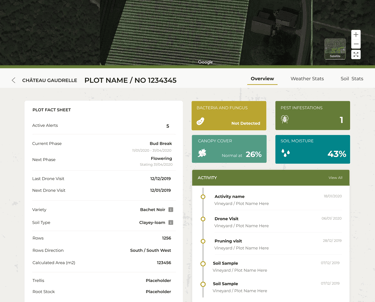
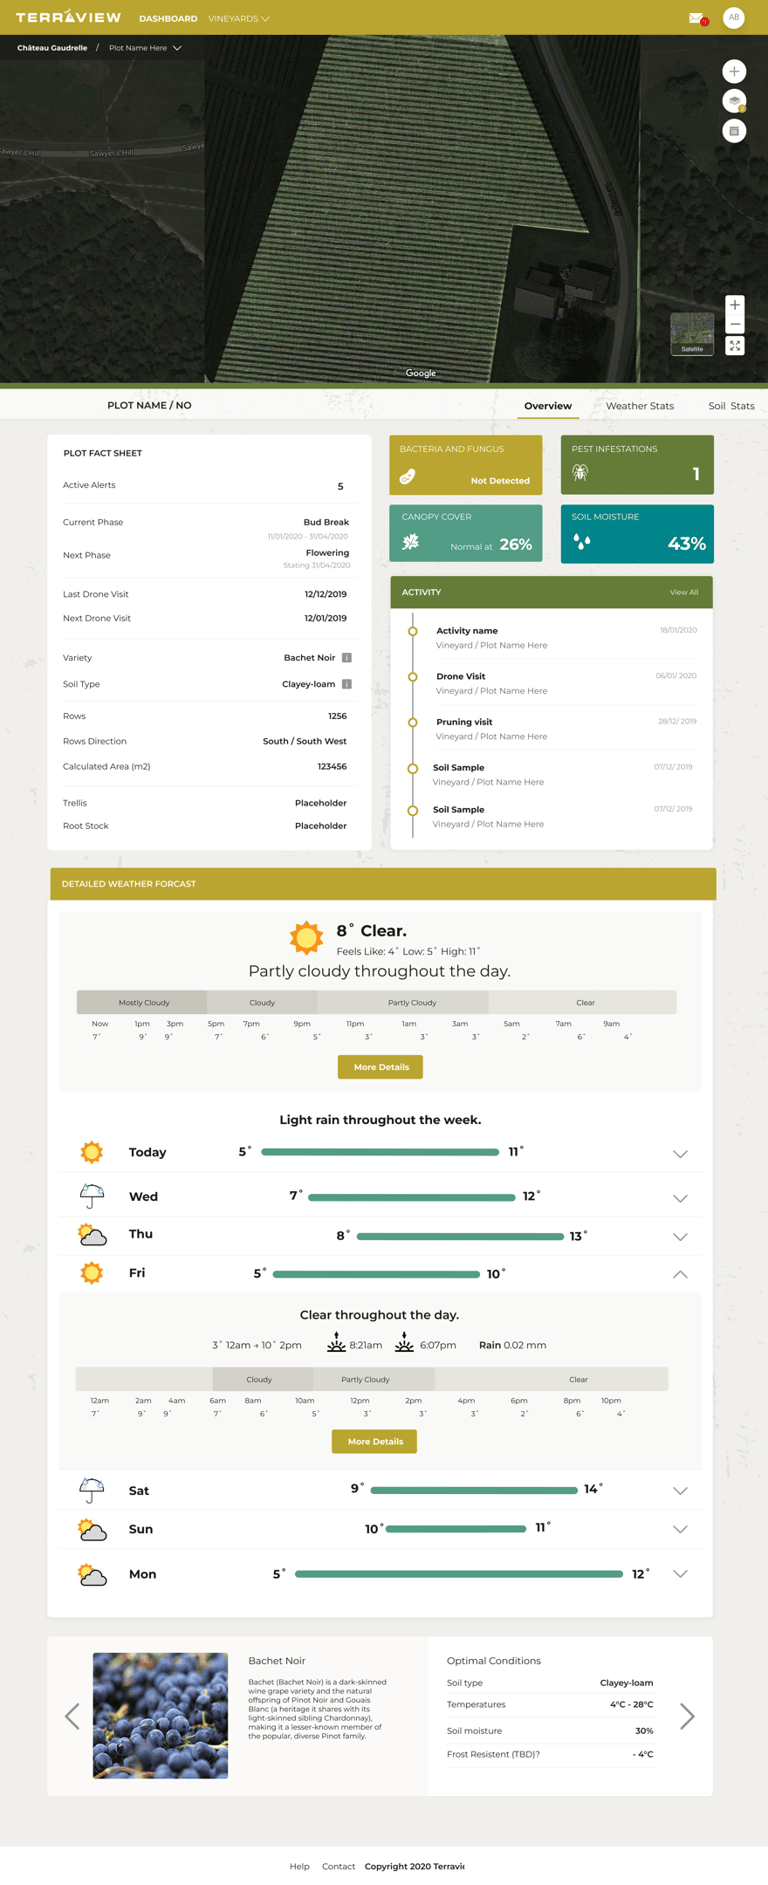
Designed a plot-level dashboard offering granular data on soil composition, moisture, and pest detection.
Implemented customisable map layers for Surface, Soil, Weather, and Water.
Interactive Features
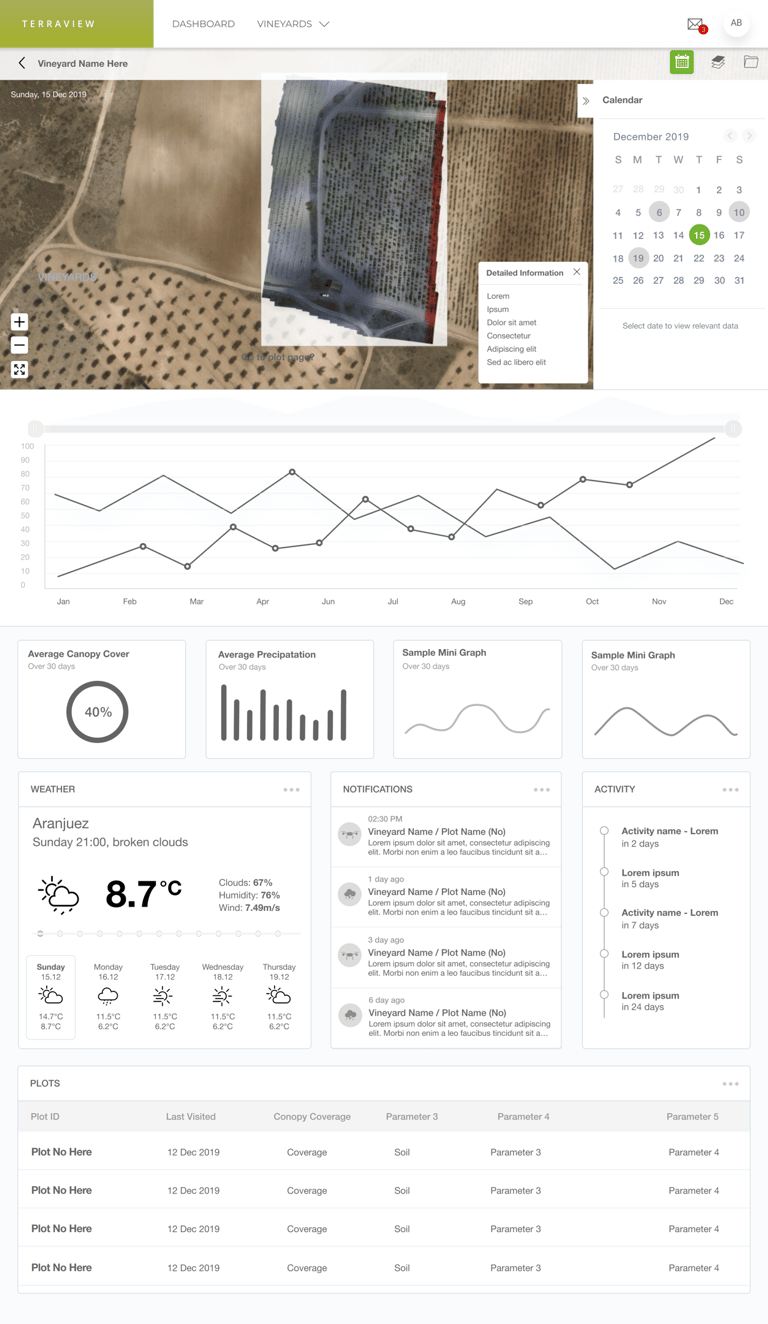
Built an intuitive notification system for tracking critical events.
Integrated a timeline view showing soil reports, drone visits, and crop development stages.
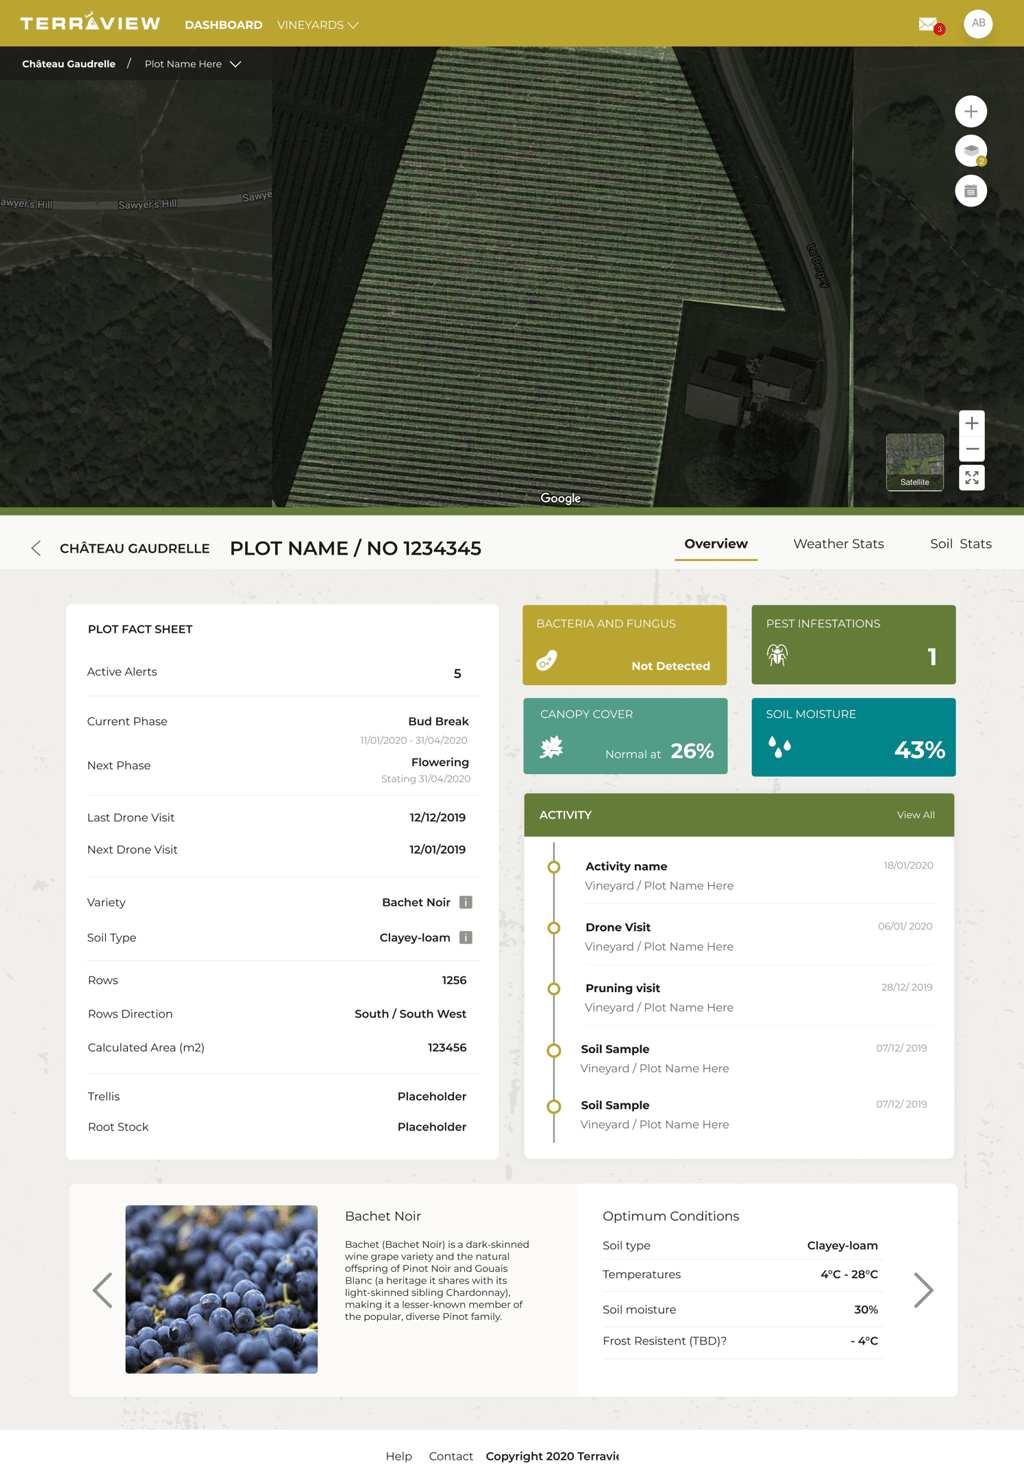
Provided detailed crop information, allowing users to track variety-specific growth metrics.
Responsive Design
Ensured full responsiveness across desktop, tablet, and mobile devices.
Used a touch-friendly interface for field use by agronomists.
Applied contrast and accessibility best practices for ease of use.
Design Documentation
Developed a comprehensive design system to ensure consistency.
Provided developer handoff documentation with detailed UI specs and component libraries.
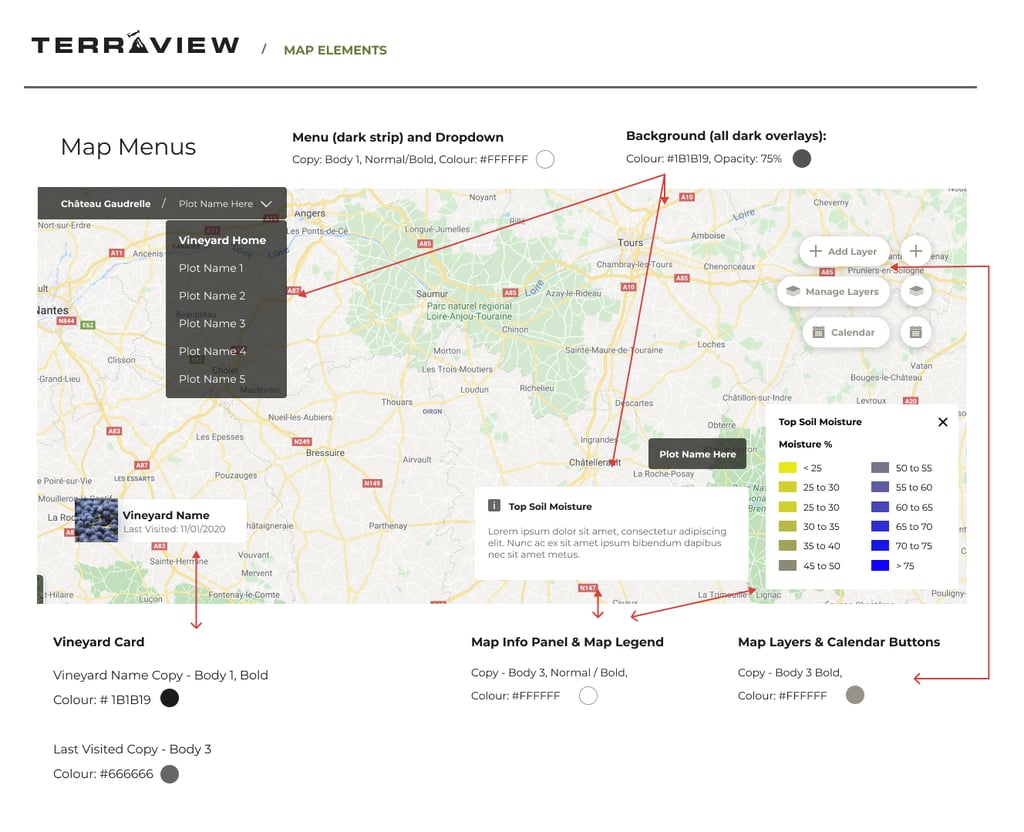
Created interaction guidelines for complex elements like map layers and data graphs.
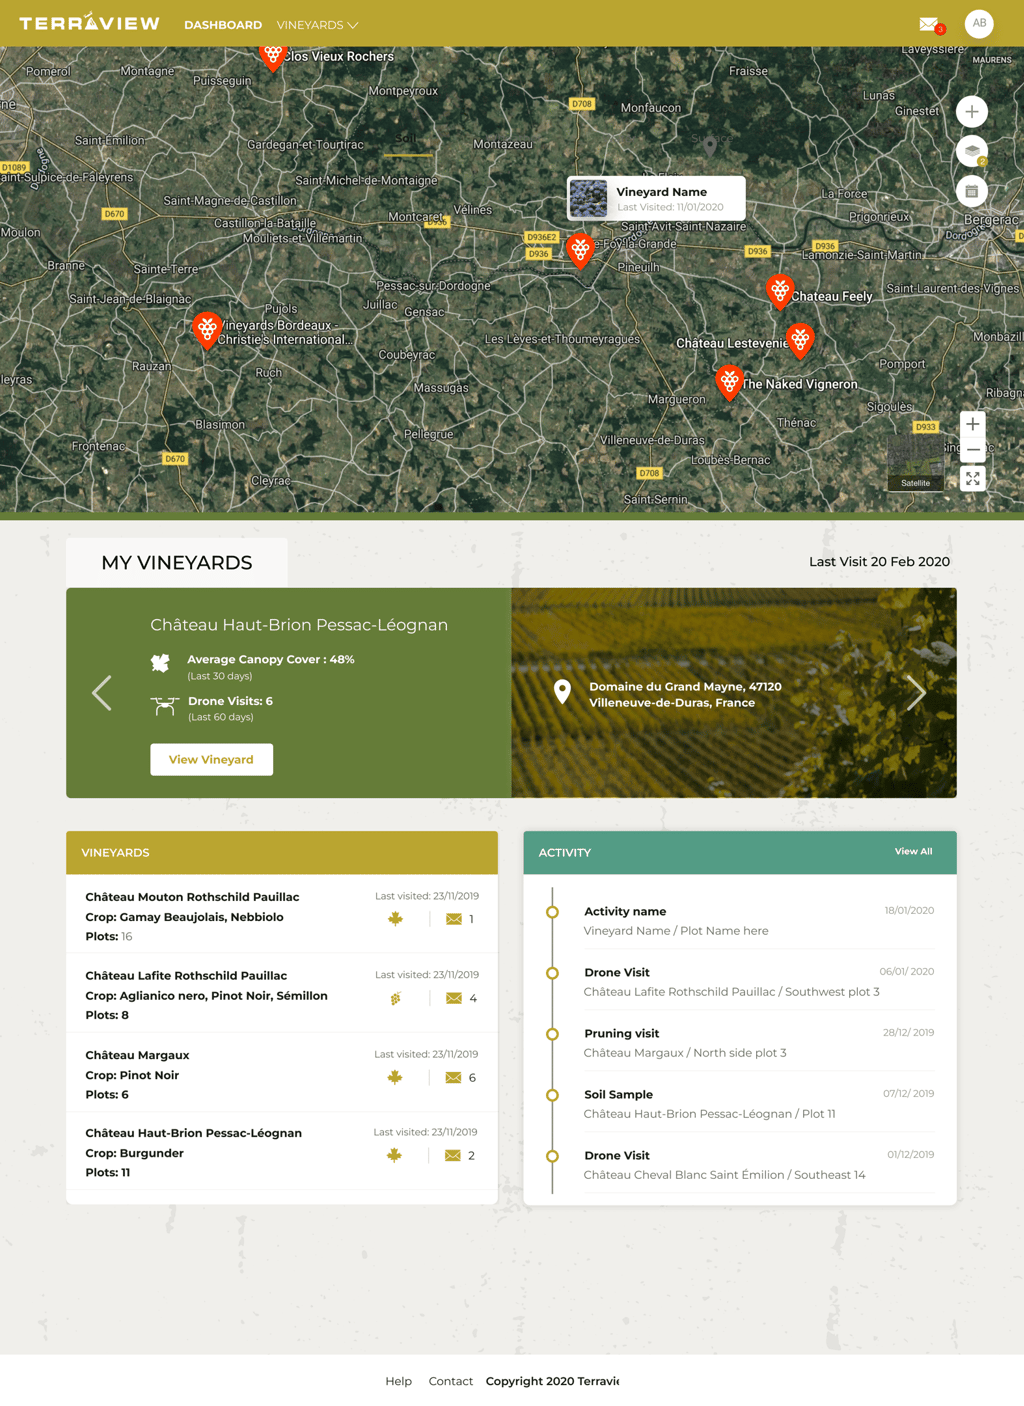
Main Dashboard
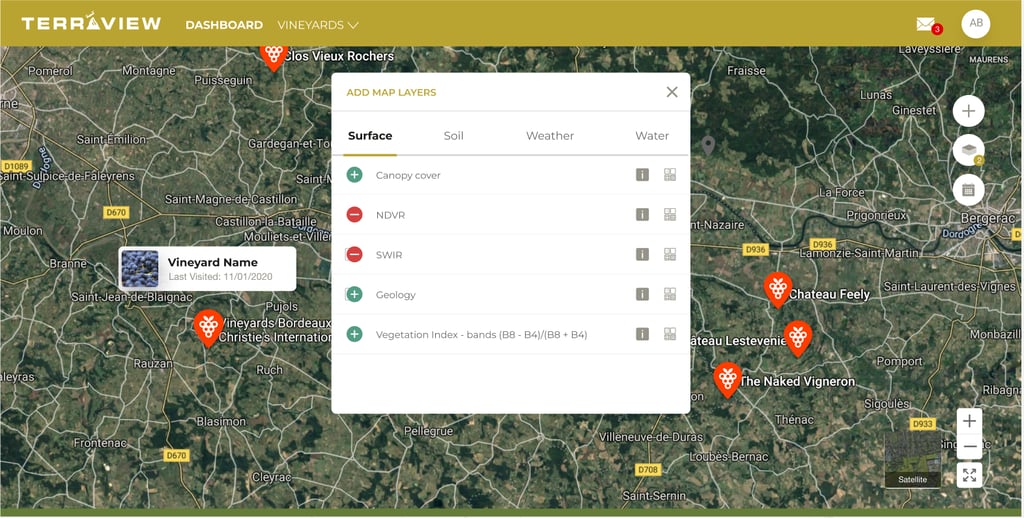
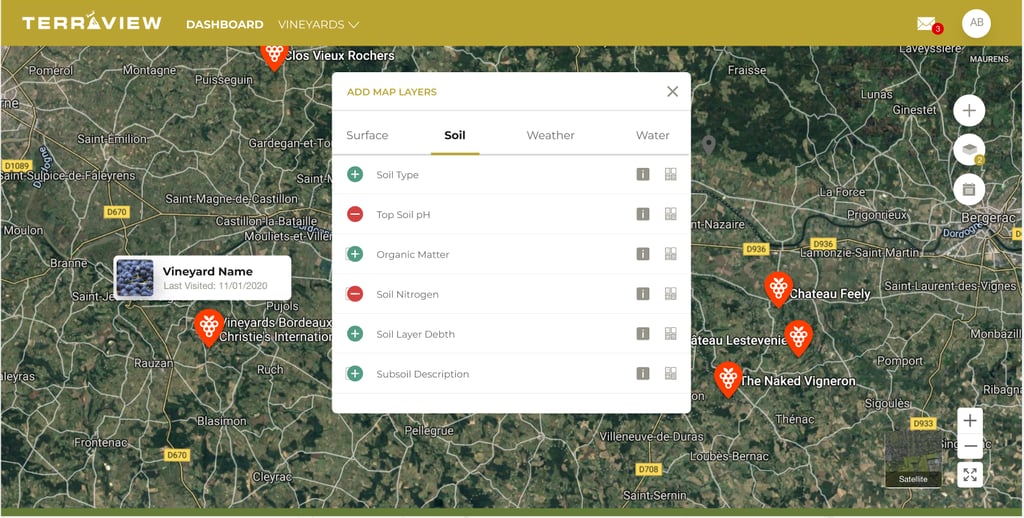
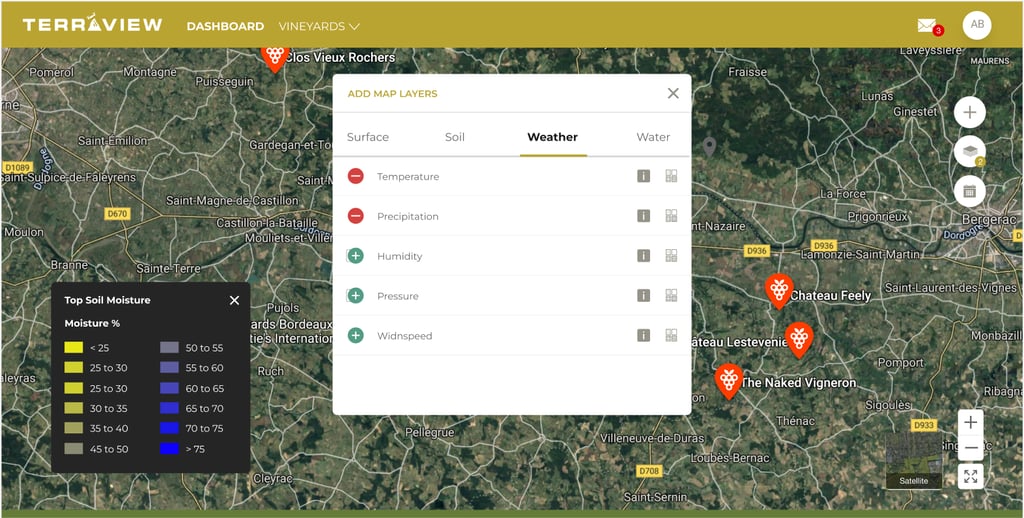

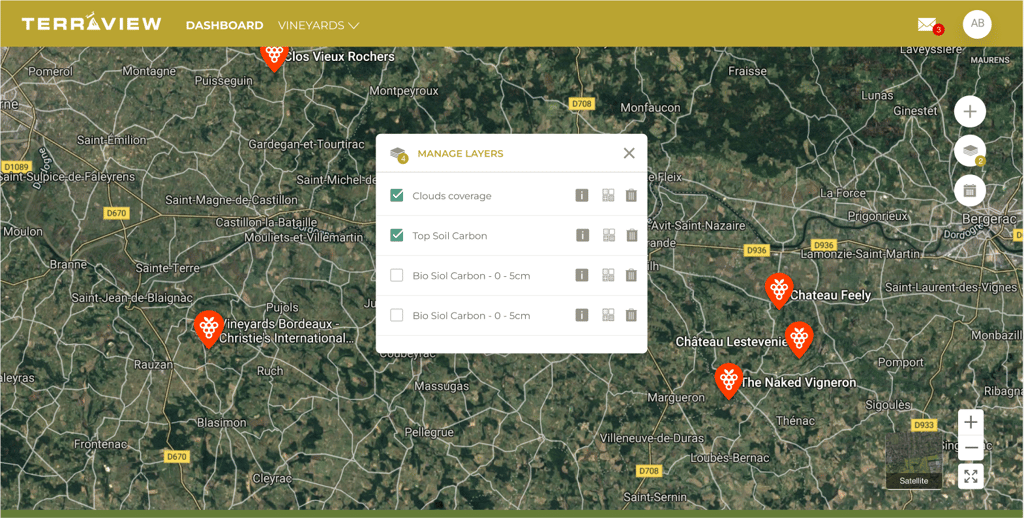
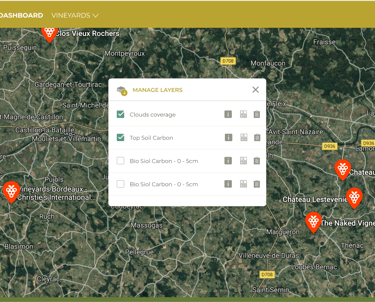
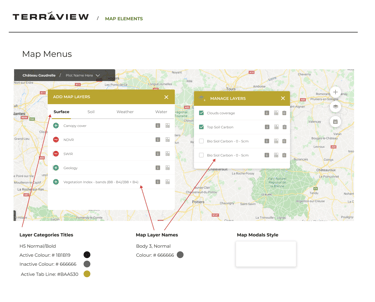
Map Layers and Settings
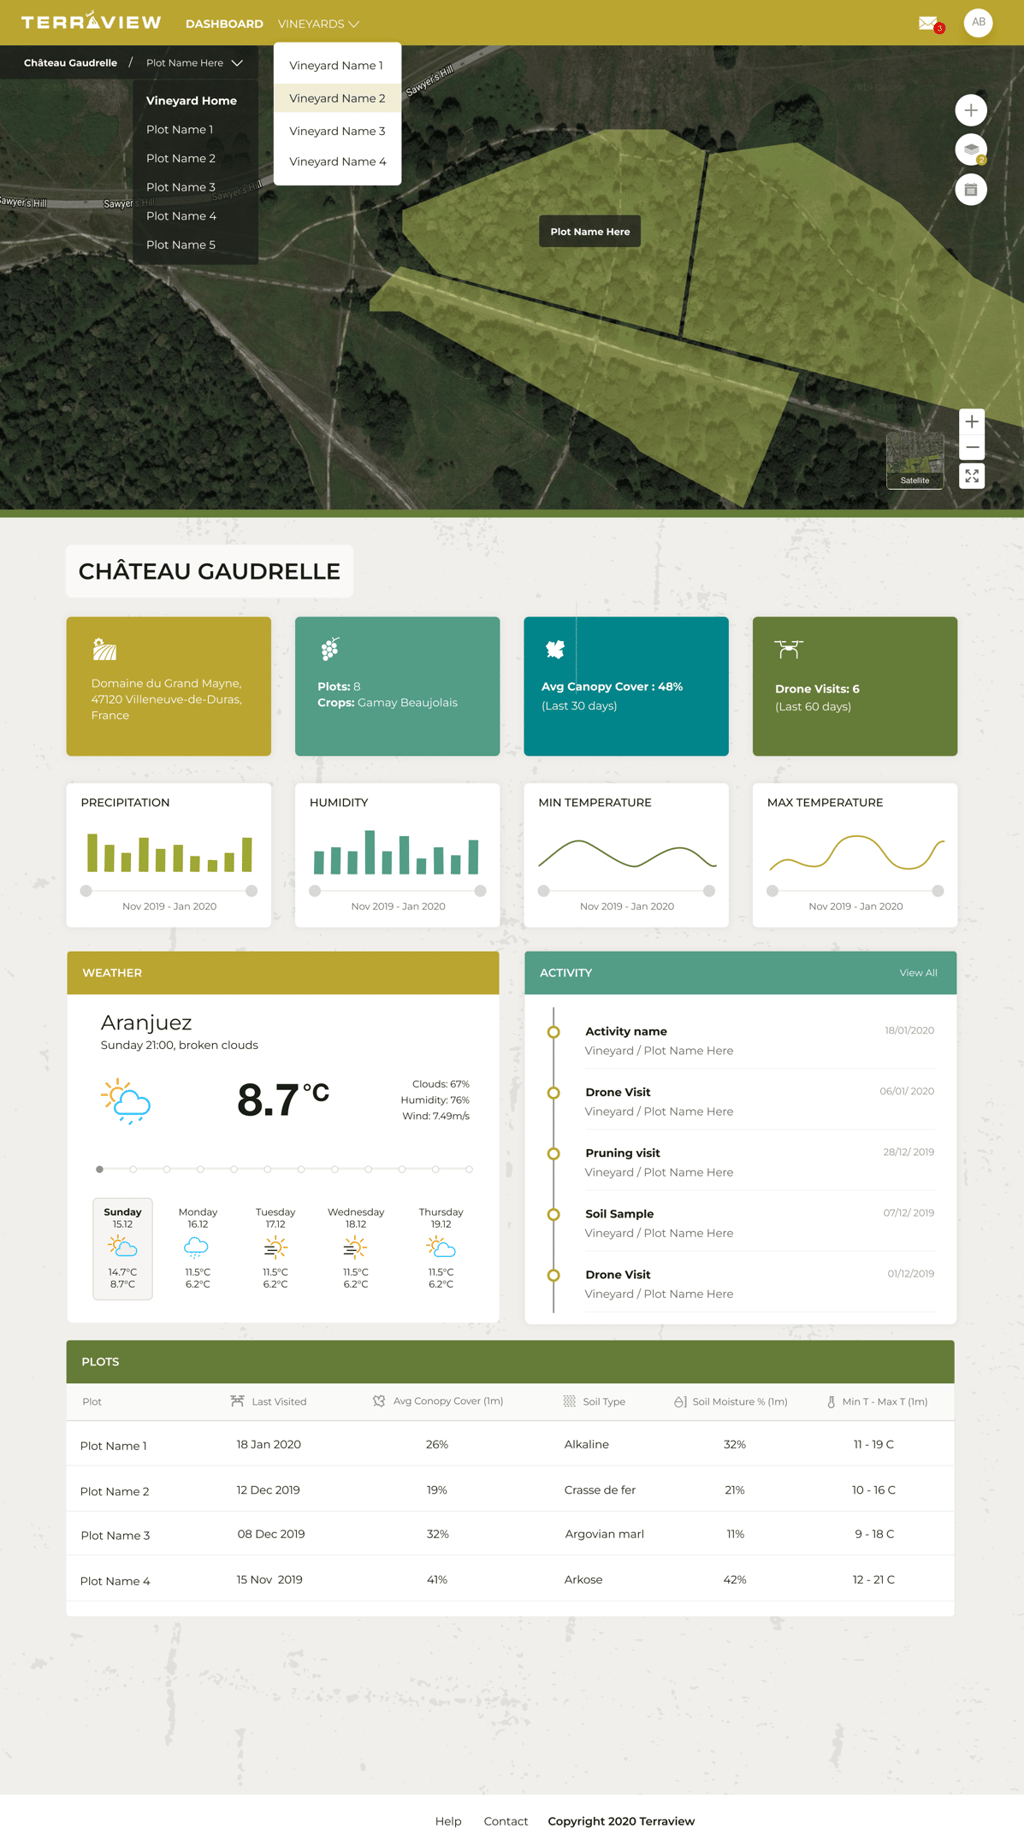
Vineyard Dashboard
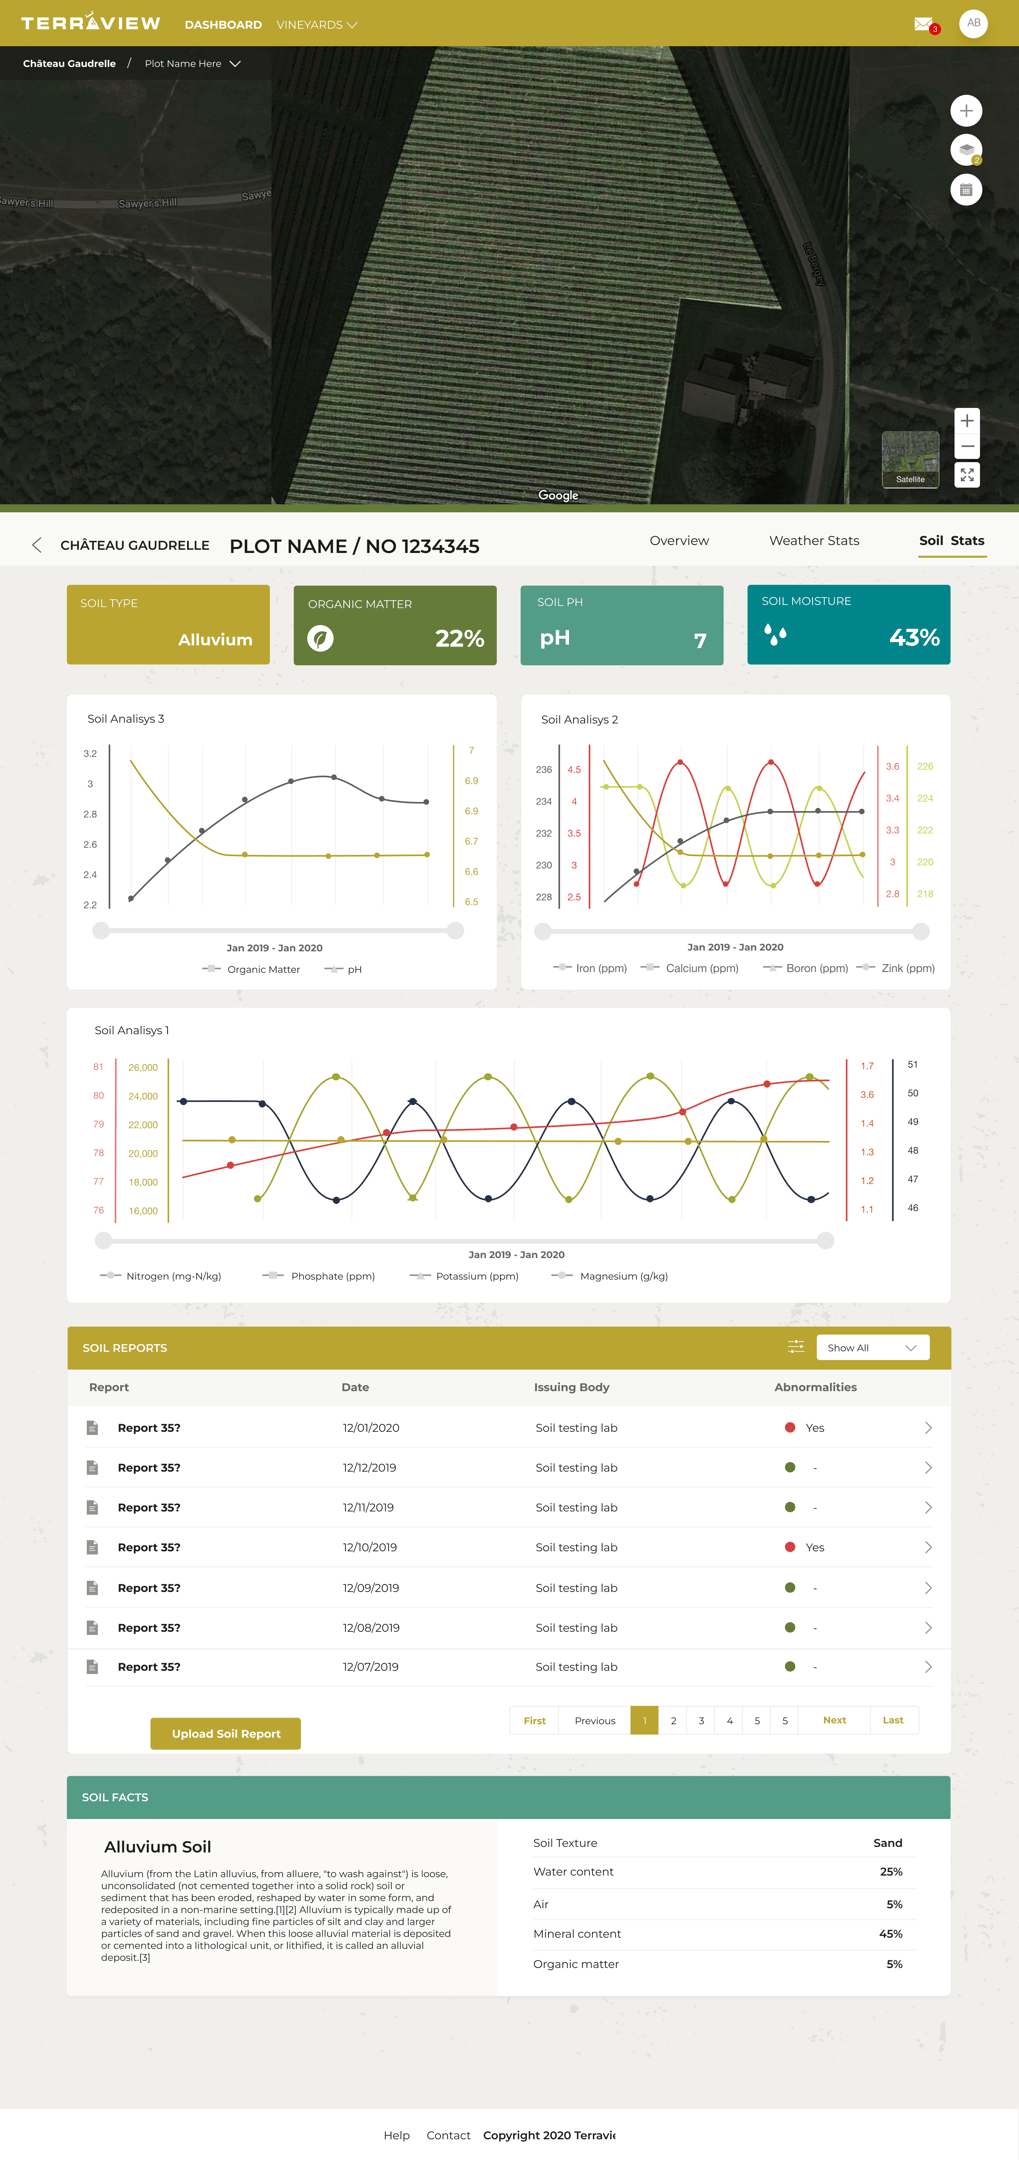
Plot Dashboard
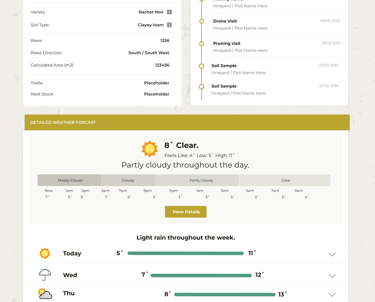
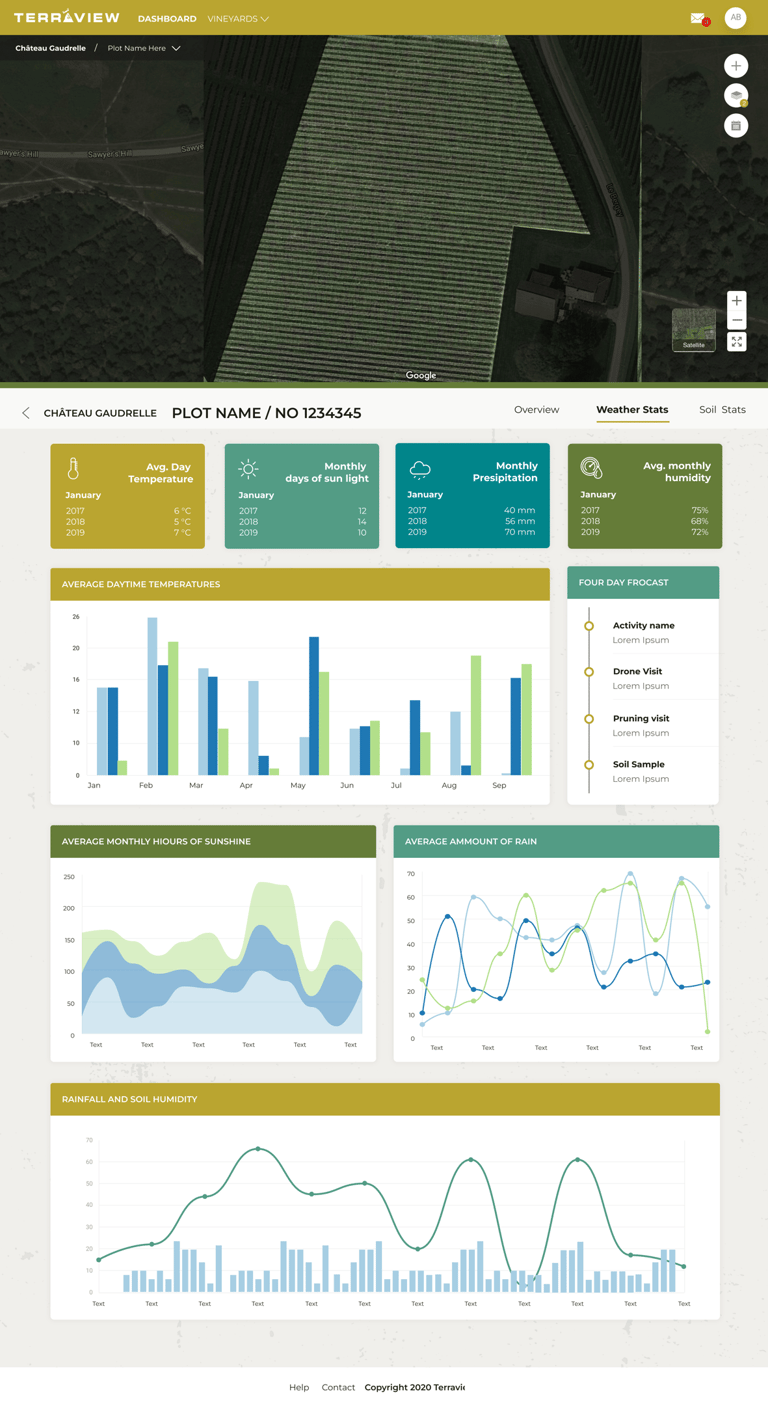
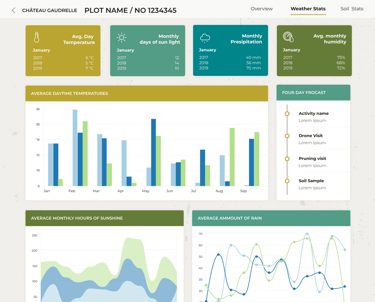
Plot Weather Stats
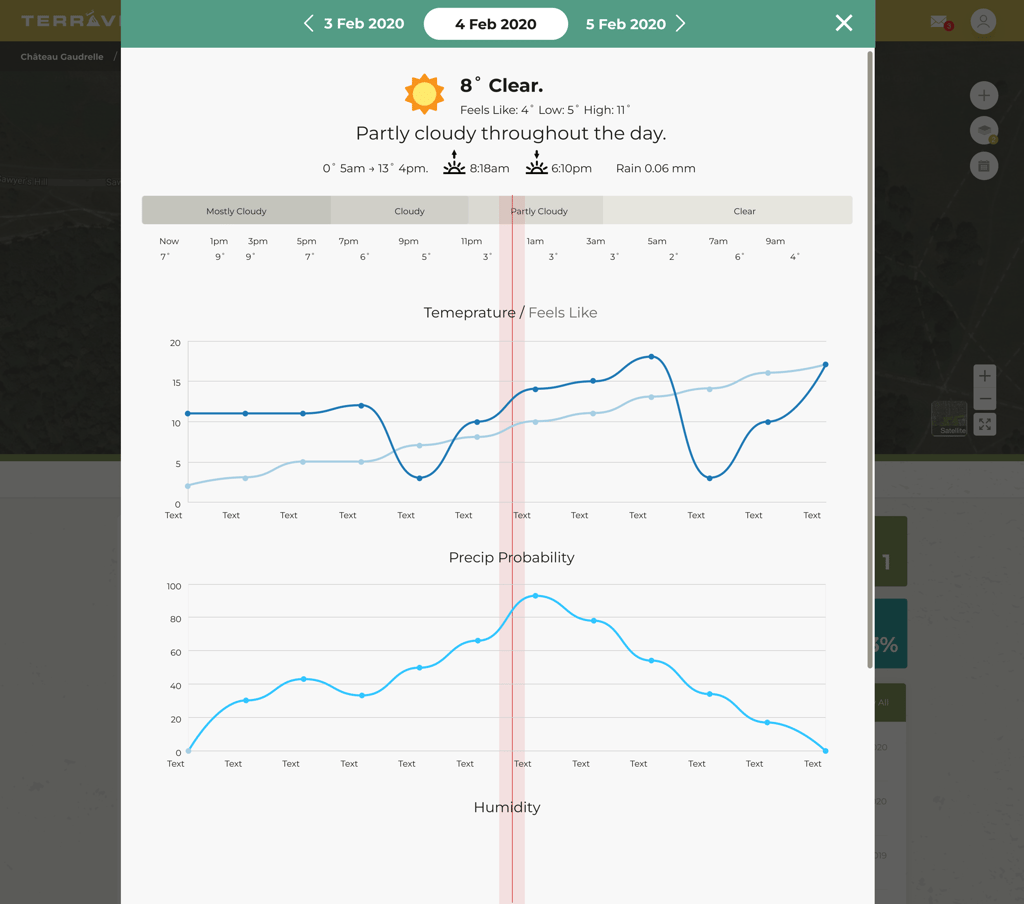
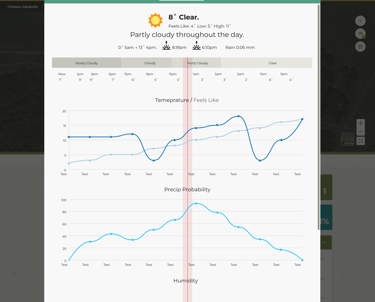
Daily Weather
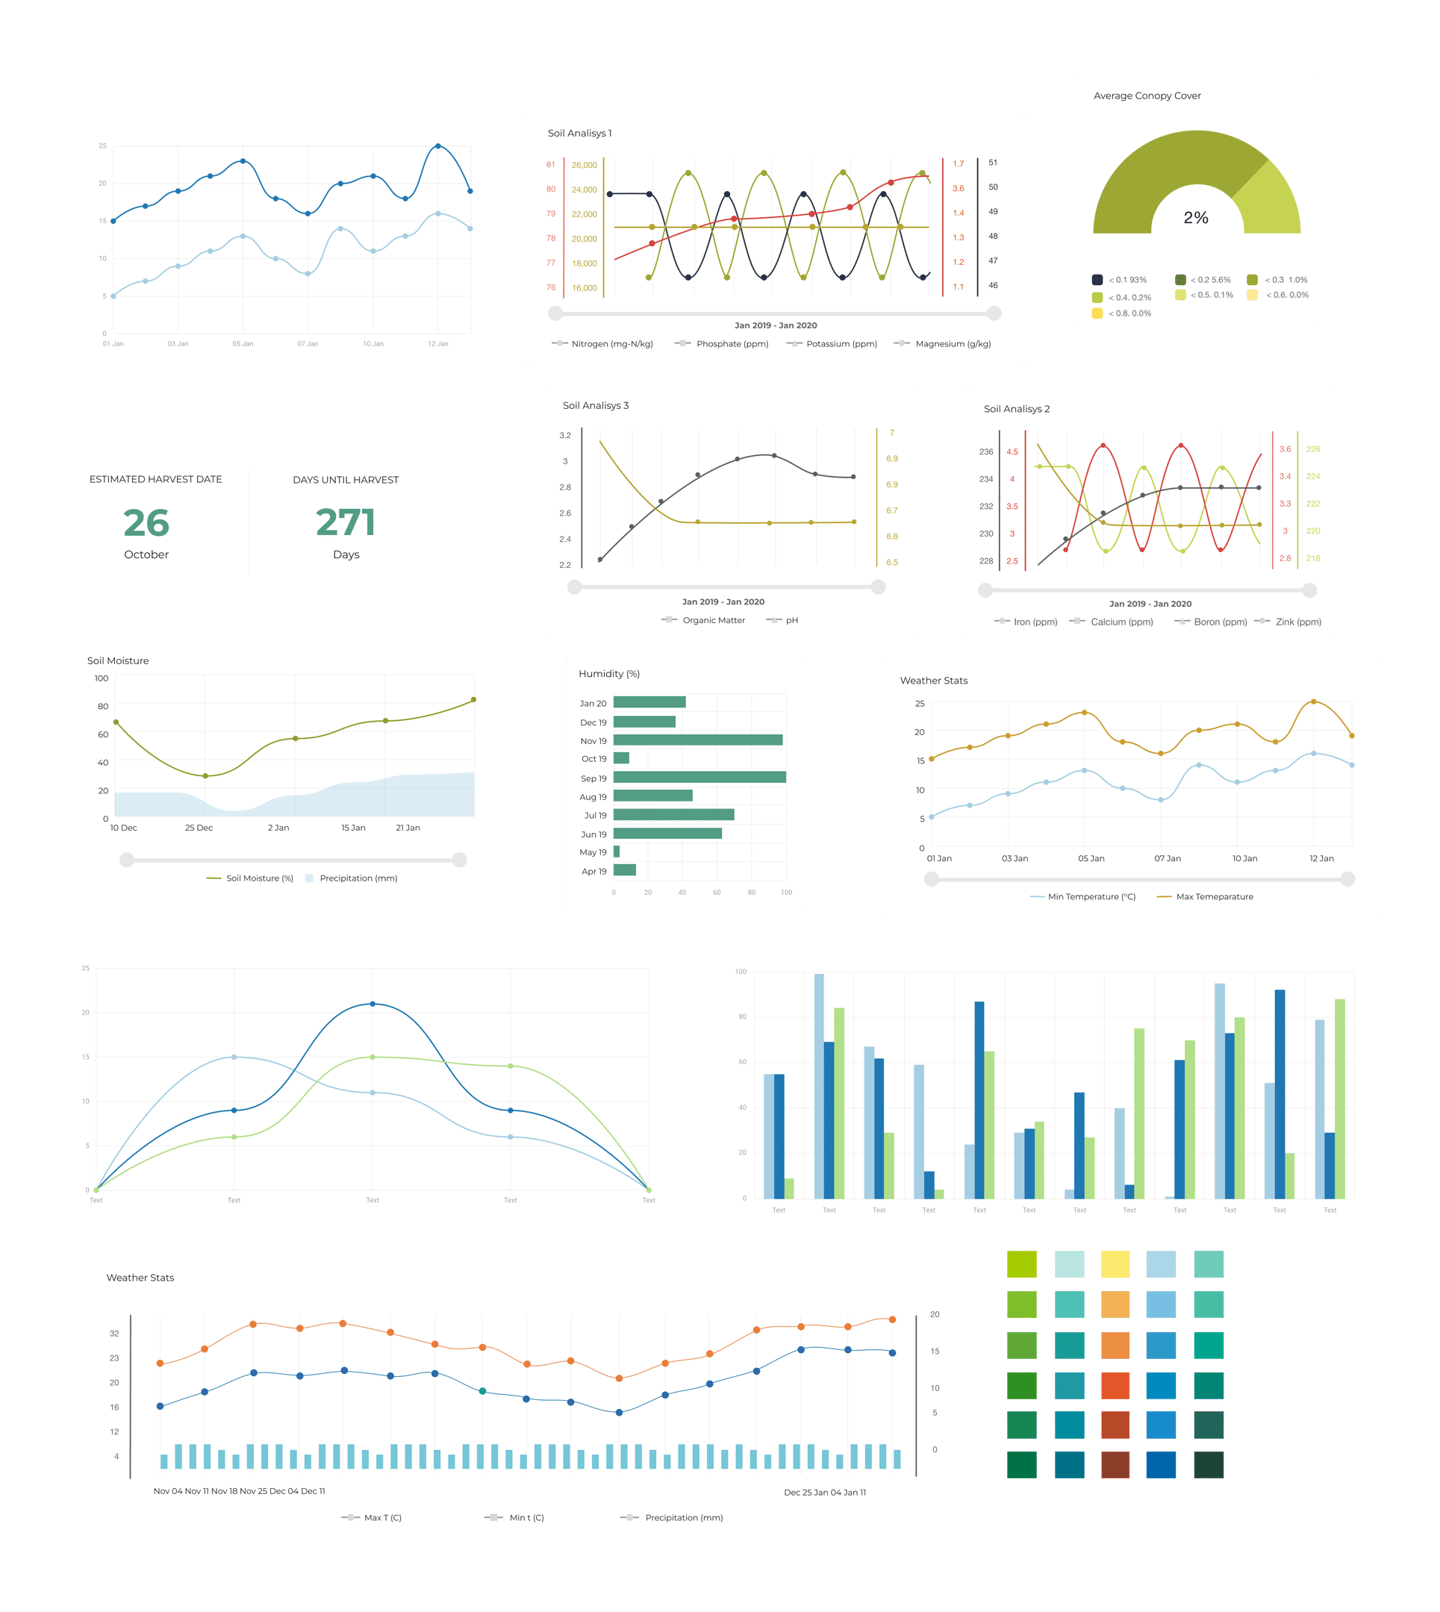
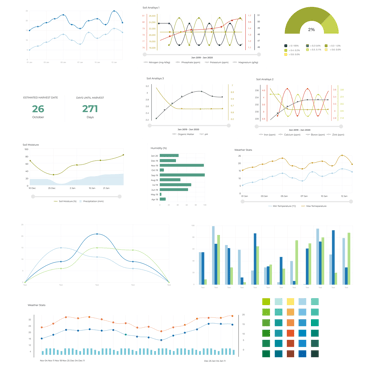
Data Visualisation & Custom Graphs
Designing the Terraview Vineyard Management Web App required creating a suite of data-driven visualisations to help vineyard owners and agronomists interpret complex agricultural data with ease. I thoroughly enjoyed this aspect of the project, as it involved transforming raw sensor and satellite data into clear, actionable insights.
Customisable Map Layers: Developed an interactive satellite mapping system with togglable Surface, Soil, Weather, and Water layers, allowing users to overlay critical environmental data on their vineyard plots.
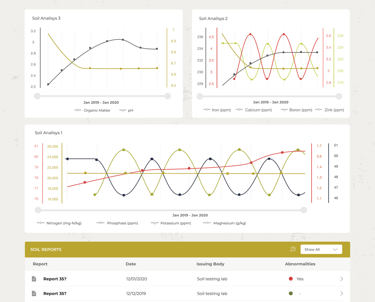
Soil Analysis Graphs: Created custom charts for nutrient composition, pH levels, and organic matter trends, enabling vineyard managers to assess soil quality over time.
Weather & Moisture Data: Designed interactive climate charts displaying temperature fluctuations, precipitation levels, and humidity trends to help predict crop performance.
Canopy Cover & Crop Health: Implemented growth trend graphs for tracking vineyard canopy cover and overall plant health, using visual indicators to flag anomalies.
Historical Data Comparison: Enabled users to compare multiple parameters (e.g., soil moisture vs. precipitation) to identify patterns affecting vineyard productivity.
By leveraging data storytelling techniques, I ensured that even non-technical users could understand complex datasets at a glance. These visualisations were not only functional but also engaging, making precision agriculture more accessible and actionable for vineyard owners.
Design Documentation
Developed a comprehensive design scheme to ensure consistency.
Provided developer handoff documentation with detailed UI specs
Created interaction guidelines for complex elements like map layers and data graphs.


Impact
Enhanced user experience with data-driven insights through real-time satellite and drone imagery.
Delivered a customisable dashboard that allows vineyard owners to track performance metrics efficiently.
Created an accessible, visually intuitive design that aligns with Terraview’s brand and user needs.
Lessons Learned
Stakeholder collaboration was crucial in understanding agricultural challenges and sensor data requirements.
Data visualisation clarity was a key factor in ensuring usability for non-technical users.
Iterative user testing significantly improved navigation and dashboard customisation features.
Final Thoughts
The Terraview Vineyard Management Web App successfully integrates IoT, satellite, and drone data into a unified, user-friendly platform. By combining robust UX research, interactive UI design, and custom data visualisation, the system empowers vineyard owners to make informed, data-driven decisions, ultimately improving efficiency and sustainability in vineyard management.